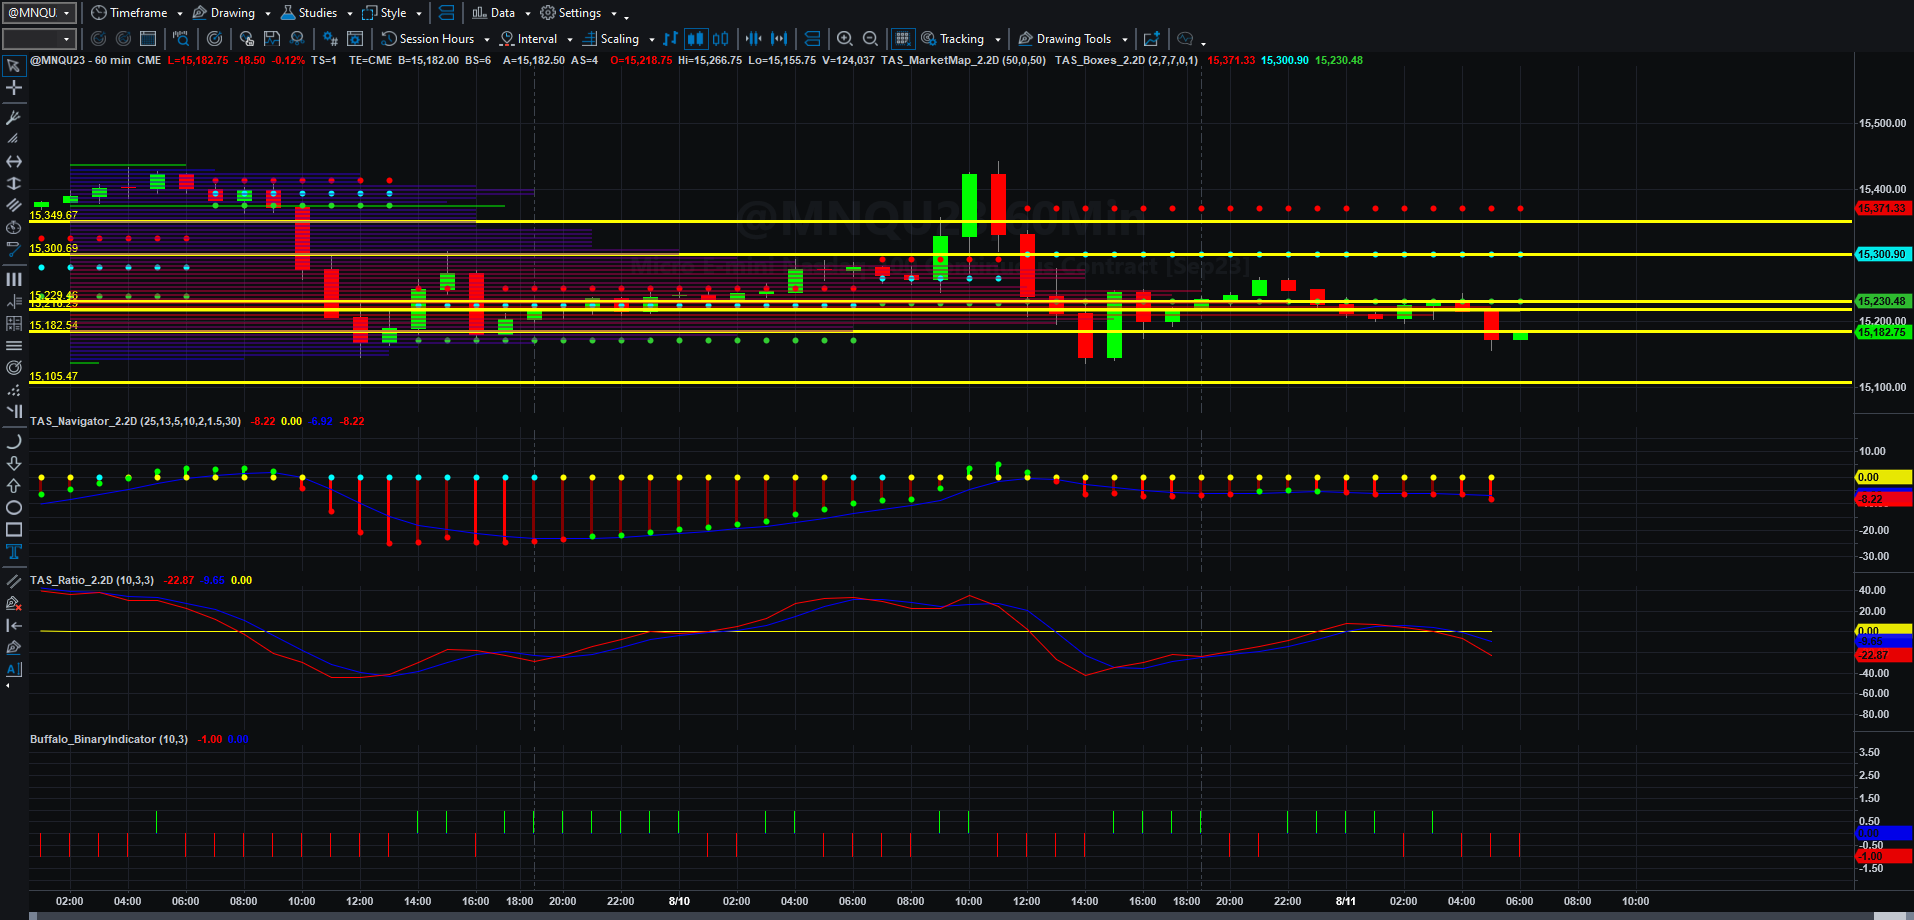
Price, Price Spread, Lagged Price/Volume Spread, and Binary Price/Volume Indicator
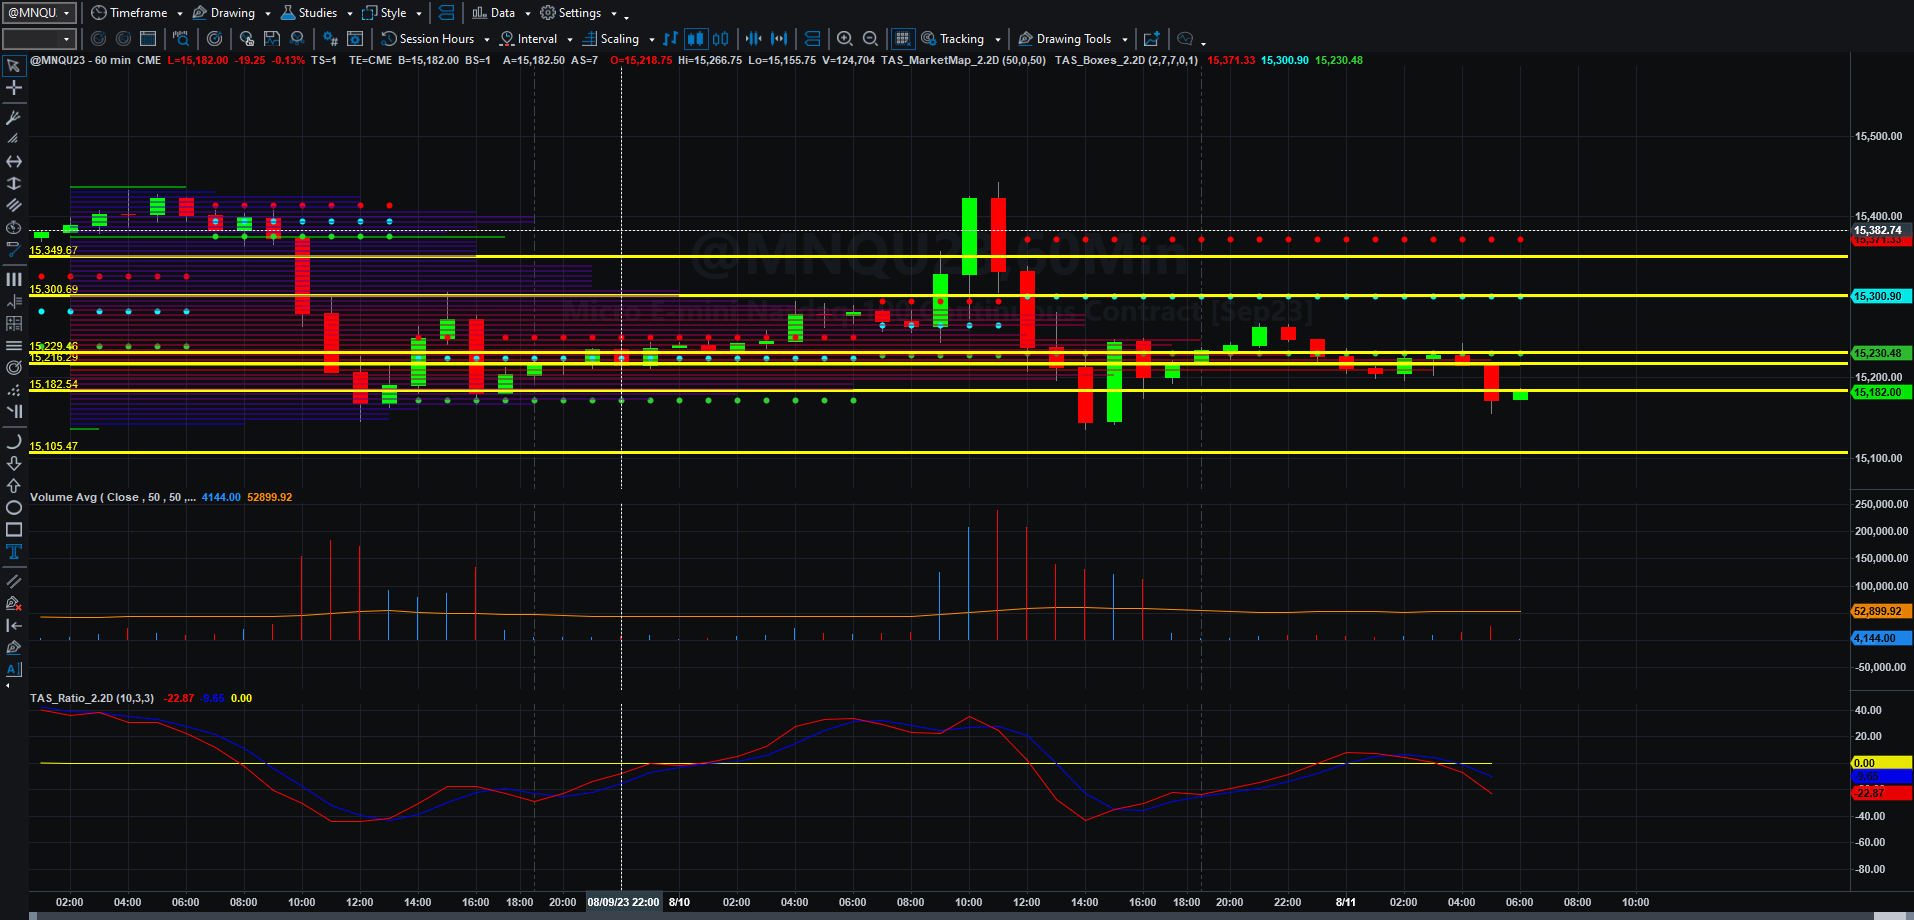
Price and Total Volume With 50-period Moving Volume Average
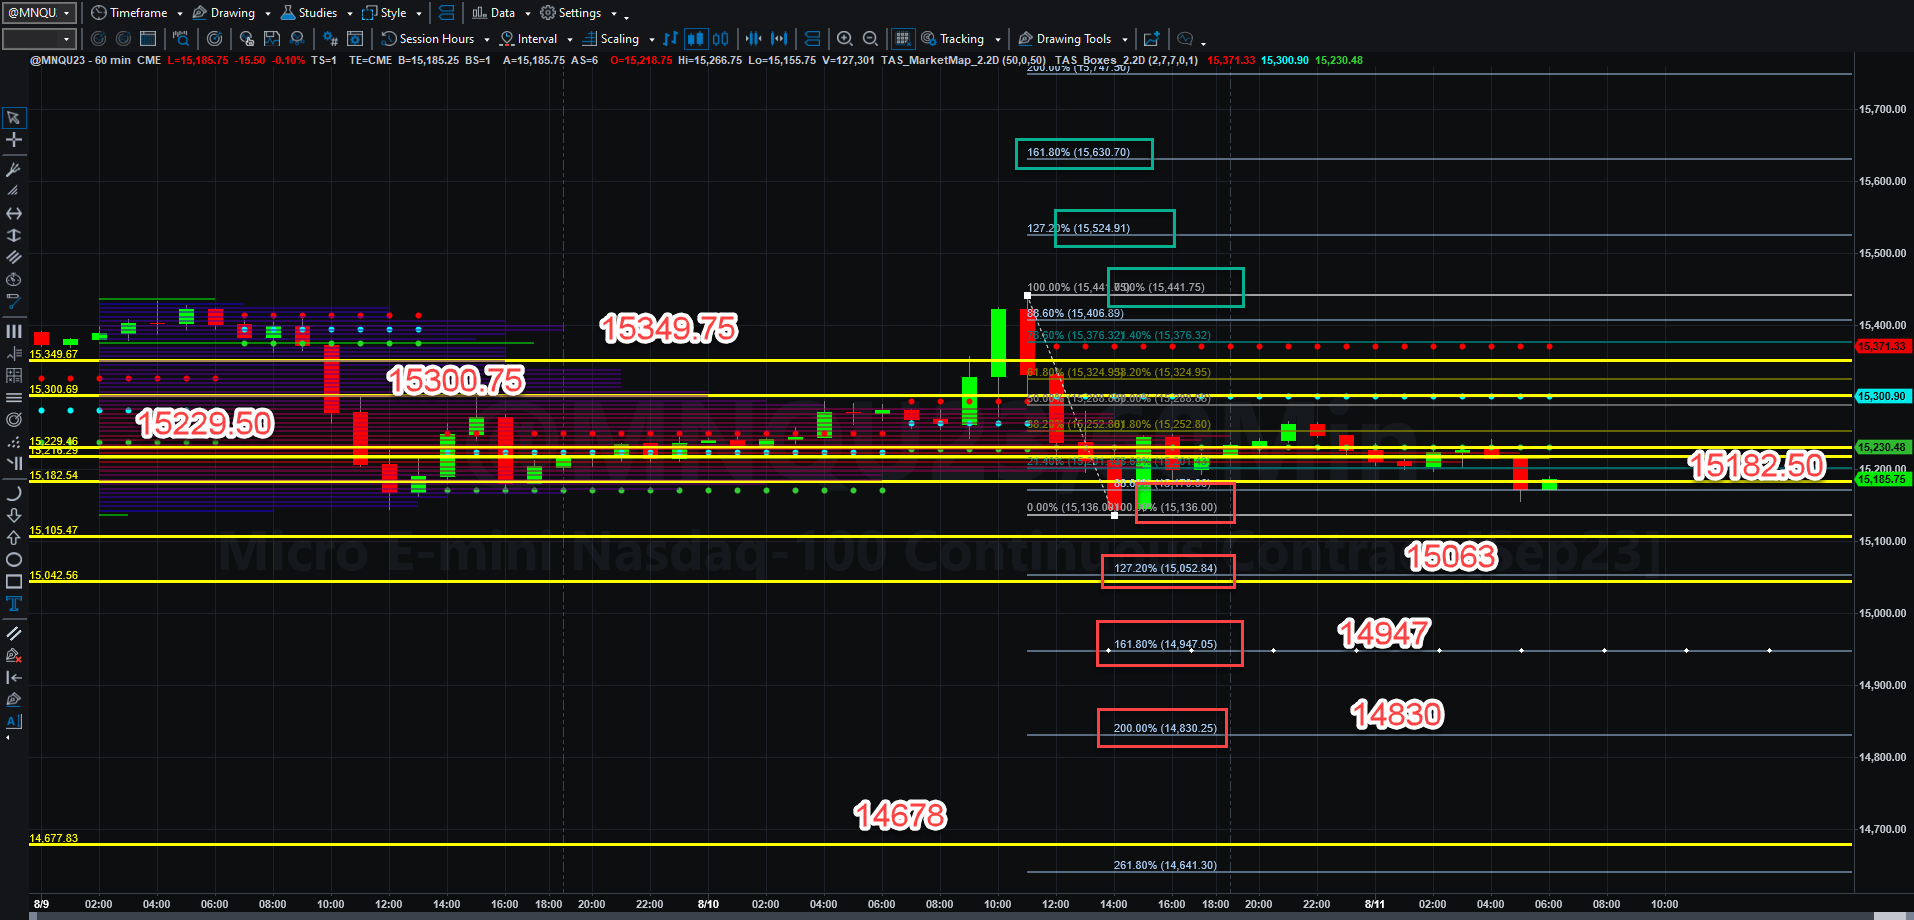
Fibonacci Price Scale With Targets
Traders and institutions were still shaken out of positions Friday afternoon based on the Federal Reserve concerns about inflation and (apparently) about loan demand dropping drastically in the PRC.
Even though there are articles that sound cheery about disinflation coming (and there could be some), the cold reality is that unrestrained Federal borrowing and spending (meaning printing of more worthless U.S. Dollars) still carry us to the brink with time. (Once again, I am not promoting Game of Trades nor am I compensated by them. They do an outstanding job of summarizing data, in my opinion). We will simply have to see how all this plays out.
At any rate, lets worry about chart price action first.
If MNQU23 can rally above 15229.50, it has a shot at taking out 15300.75 and 15349.75 VWAP lines on the way back to 15441.75, based on the width of the candles that preceded the selloff on Thursday. If that happens, it may even be possible for MNQU23 to rally back to 15525 and 15630.75 by Monday, as commercial holdings would not be a source of price resistance.
If not, however, MNQU23 could sell back pretty quickly back to 15136, and perhaps even as far as 14947 and 14830 by Monday, as there is a lack of commercial holdings above 14677.
Today could be the day that traders simply square positions and walk away for the weekend, but we will simply have to watch and see the action.
I picked up yet another 25 NQ points long yesterday in a similar fashion to the way I picked up 25 NQ points short on Monday, which will be discussed in the video this weekend. Stay tuned for that.
That is all I have for today. Have a profitable and pleasant Friday and hopefully a relaxing weekend!
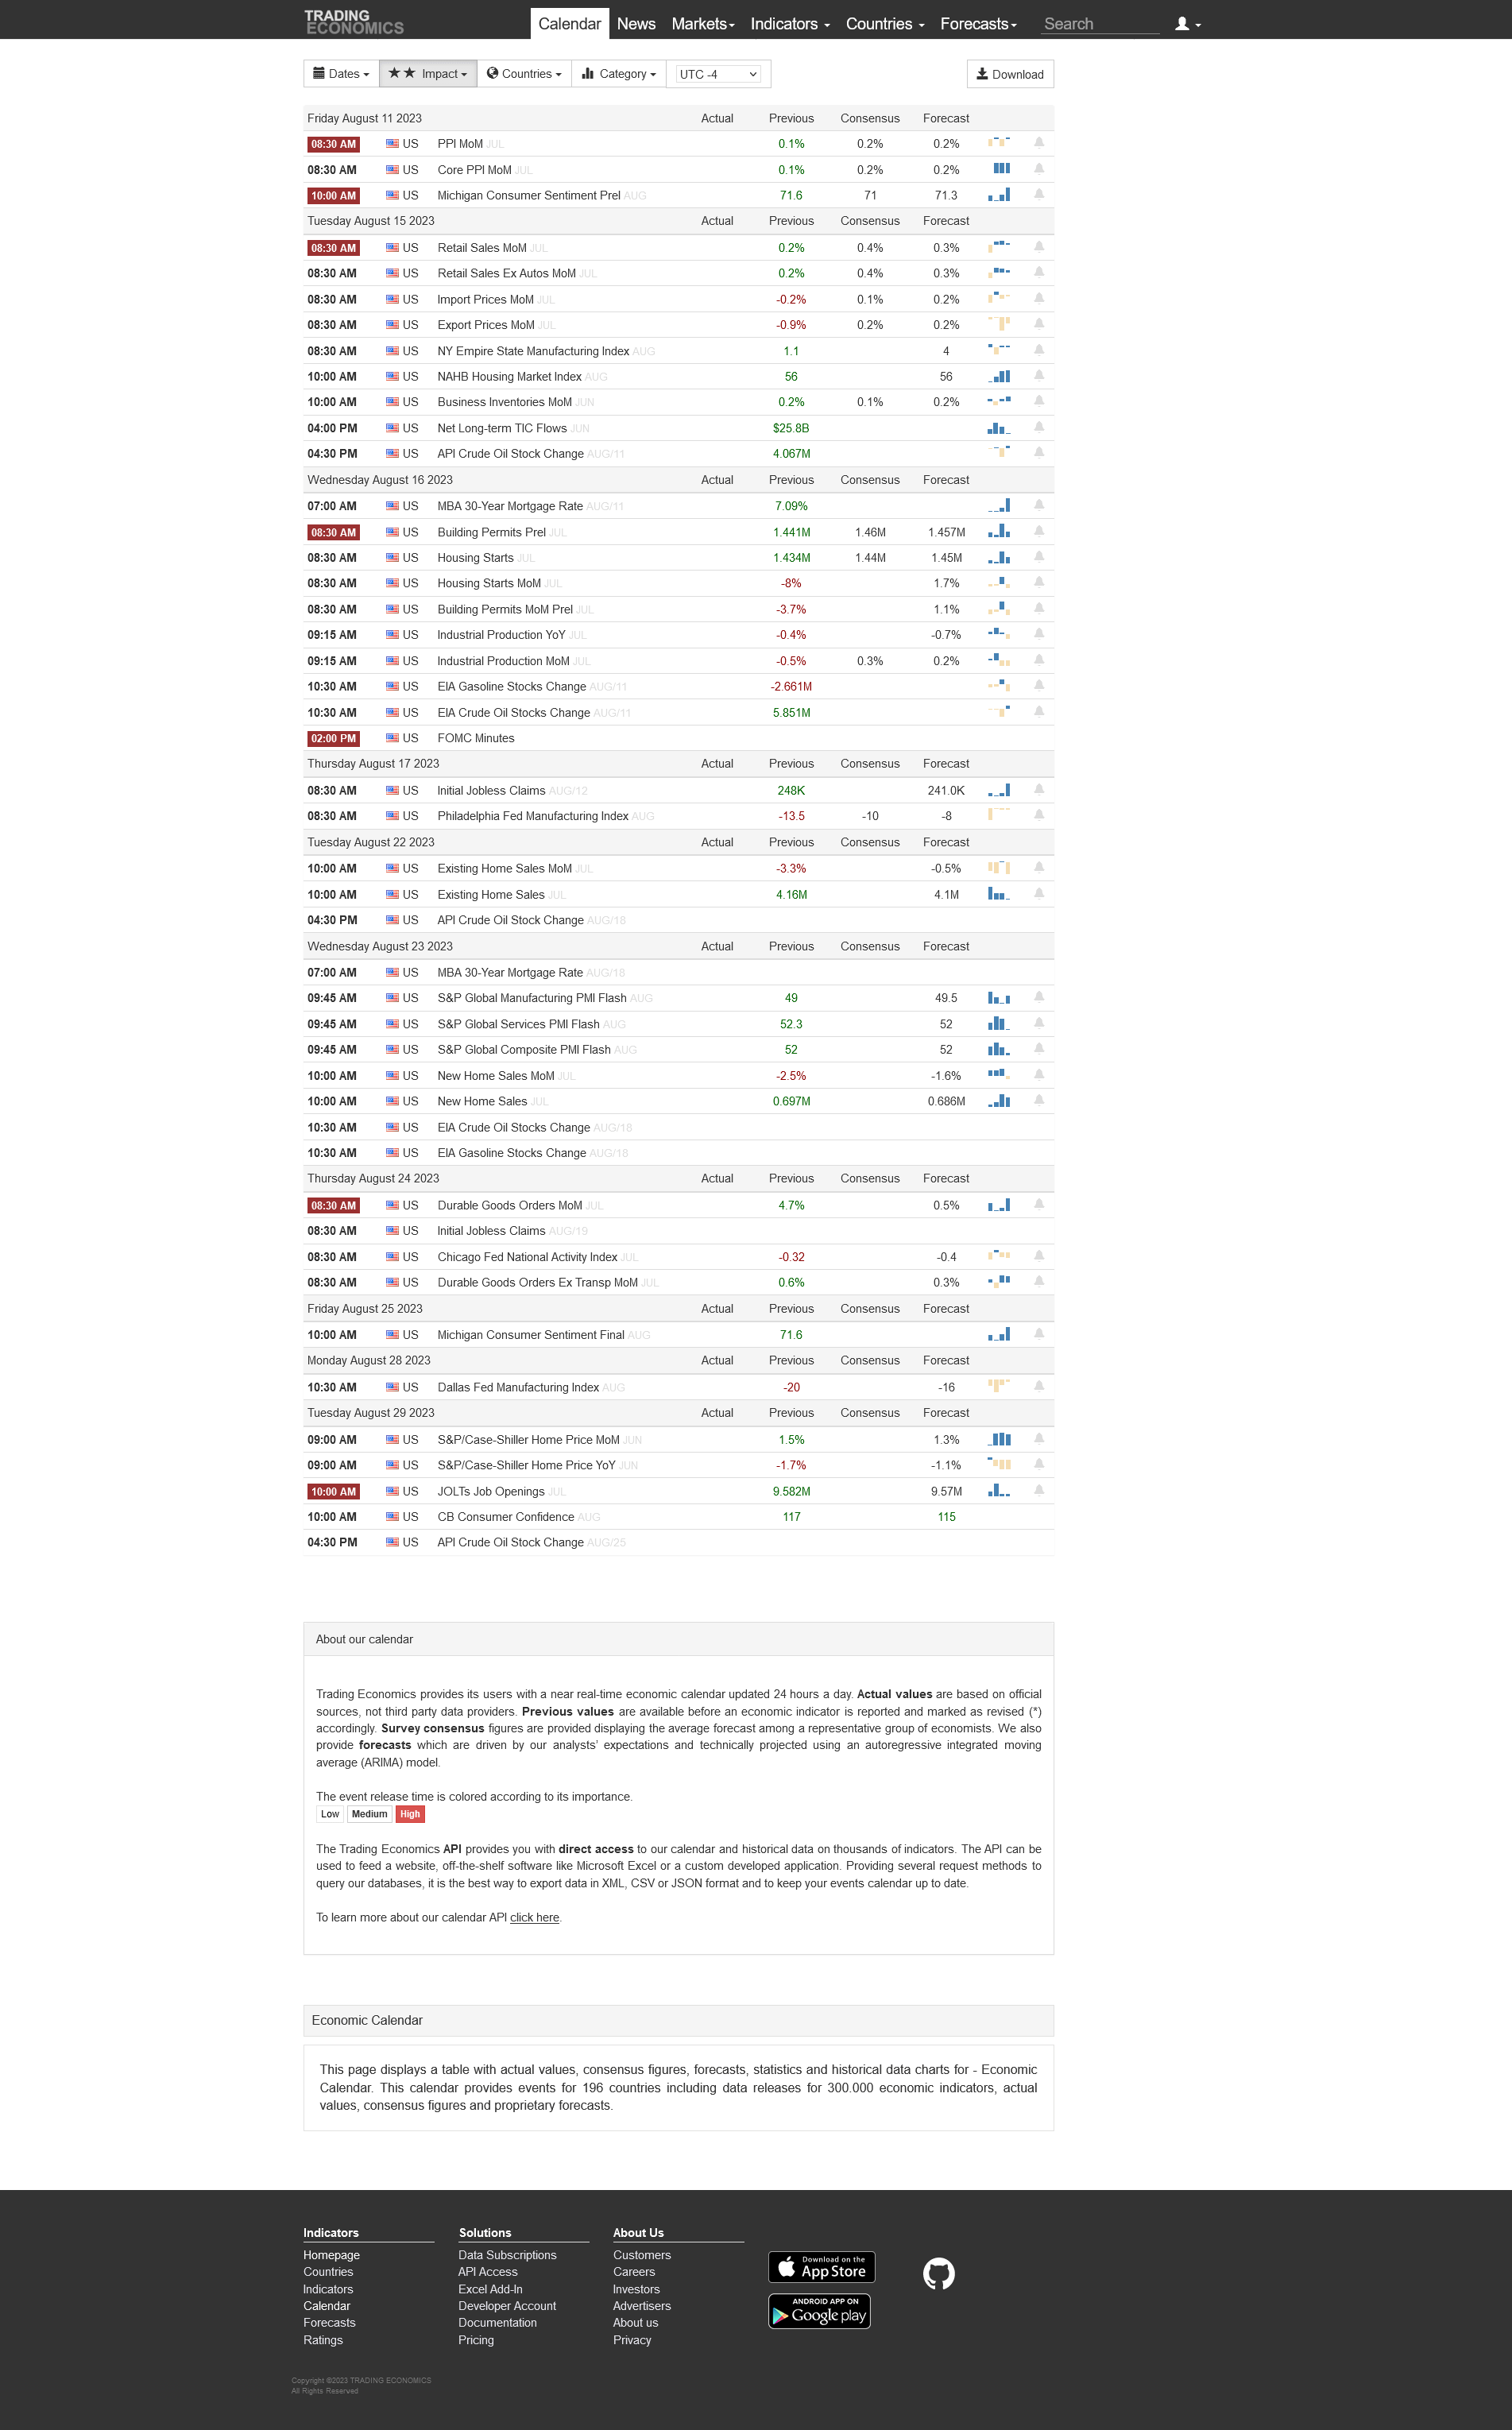
Today’s Economic Data Courtesy of Trading Economics dot com. Be sure to refresh the date at the top left.