

If you want to cut to the chase on the video, the monthly analysis starts at 0:19, the weekly analysis at 4:41, and the daily analysis at 6:49.
Save for Friday’s relative weakness, shown by the rather bearish close, MQNU23 is basically on fire and still seems to have energy left for higher prices despite being overbought by the measures of price momentum and to a greater extent the lagged price x volume momentum indicator (or ratio in this case).
If you do situational price pattern analysis, I found a video that tends to corroborate past history with recent price action in developing a bullish market case. Even if I question how good it is given the fact that many of the economic and geopolitical situations tend to blunt this analysis, it tends to favor higher price action. (You may have to rifle through the 45+ minute video, but it is worth taking a look).
But in the real world, things are not so pretty on the ground. The Black Sea grain agreement between Ukraine and Russia may collapse, leading to a potential humanitarian crisis. When you add the dam explosion to the mix, whose origin is quite sketchy from Ukraine’s perspective, more trouble could be ahead for agriculture there in the future.
And on the energy front, as Russian sanctions continue to fail, the Biden Administration seems unwilling to refill the Strategic Petroleum Reserve which he used to soften the price spikes created by his willful interruption of hydrocarbon drilling as part of his “Green New Deal”. As time goes on, particularly if the Uniparty remains in power in January 2025, this will likely lead to higher gasoline prices, as there is no safety valve to reduce price pressures from OPEC+production cutbacks.
When it comes to liquidity, central bank balance sheet liquidity has broken its close correlation with QQQ this year. It could mean that the Federal Reserve's free casino money could in fact be drying up. We will simply have to see.
In opposition to the “risk-on” evidence provided in the video referenced above, we have this data from noted (and pretty damned accurate over time) quantitative analyst, Dr. John Hoffman, showing an expected 10-year return “in excess” of treasury bond yields to be -7.2% (meaning the $SPX will deliver by his estimates a 7.2% return BELOW those of Treasury Bonds (in this case 10-year treasury bonds).
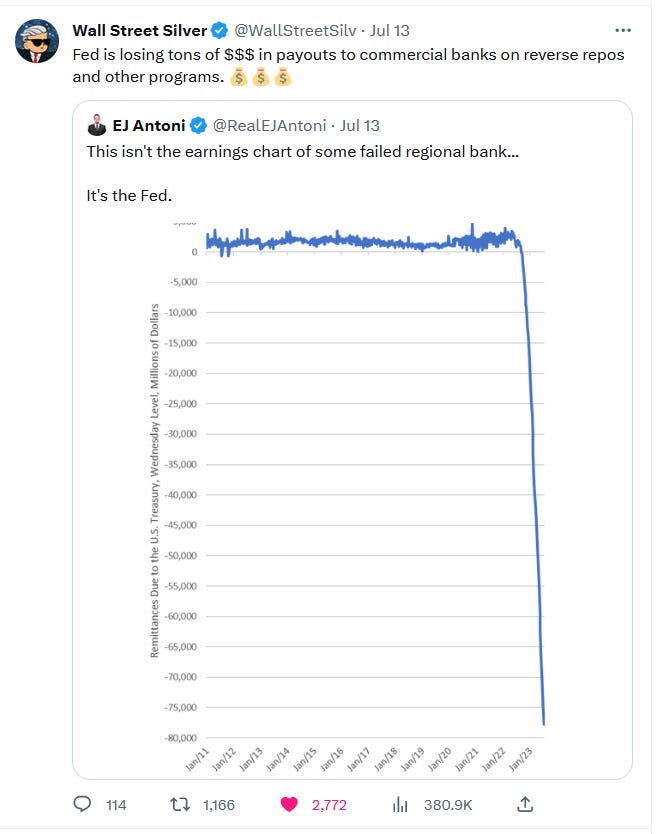
And on reverse repos, the Fed is taking a beating when making payouts to commercial banks.
Despite all that, American investors seem positive about near-term stock prices and continue to purchase equities. As long as the perception holds, then MNQU23 and other markets will push higher. I am still horribly skeptical of valuations, but since I can be long and short without any real difficulty, I will simply trade my trade plan until I see a reason to buy a stock on a discounted earnings growth basis with a great-looking chart.
I am not holding my breath waiting for that moment, however.
That is it for me at the moment. Give me until the end of the week to display the additional charting. I am wrapping up new things and that will take first priority. I do think you will like what you see though! Have a pleasant and profitable week everyone!

