

Please, if you can, watch the video this week. I did not purposely start Part 3 of Setting Up The Trade because I wanted to introduce the concept of volume in literally 3 different ways. Today, I show you how two of them interact in a comparison of volume average and the binary indicator which combines price volume in a real time fashion using front weighted data like Jurik indicators for price only.
The discussion of monthly data begins immediately (0:00), the weekly data analysis begins at (04:59), and the daily analysis begins at (09:08). The key thing to take away is that despite all the news, panic, fear, loathing, joy and desperation of economic news over the last week and the previous month, we still seem to be at or near some kind of inflection point that would appear to be bearish on the monthly basis, seemingly bearish on a weekly basis, and perhaps slightly bullish on a daily basis, even though the daily chart seems a bit overbought in terms of price/volume momentum.
This chart below shows you how a daily projection from last week actually turned out. What you need to understand is that this is not a bullet proof perfect forecast, it was and is an accurate projection of a reasonable symmetrical price gain that Gartley used when he traded. Those same principles work some nearly 95 years later. Even algorithmic trading cannot destroy market symmetry in distinctively volatile markets like the current one. Here’s the chart:
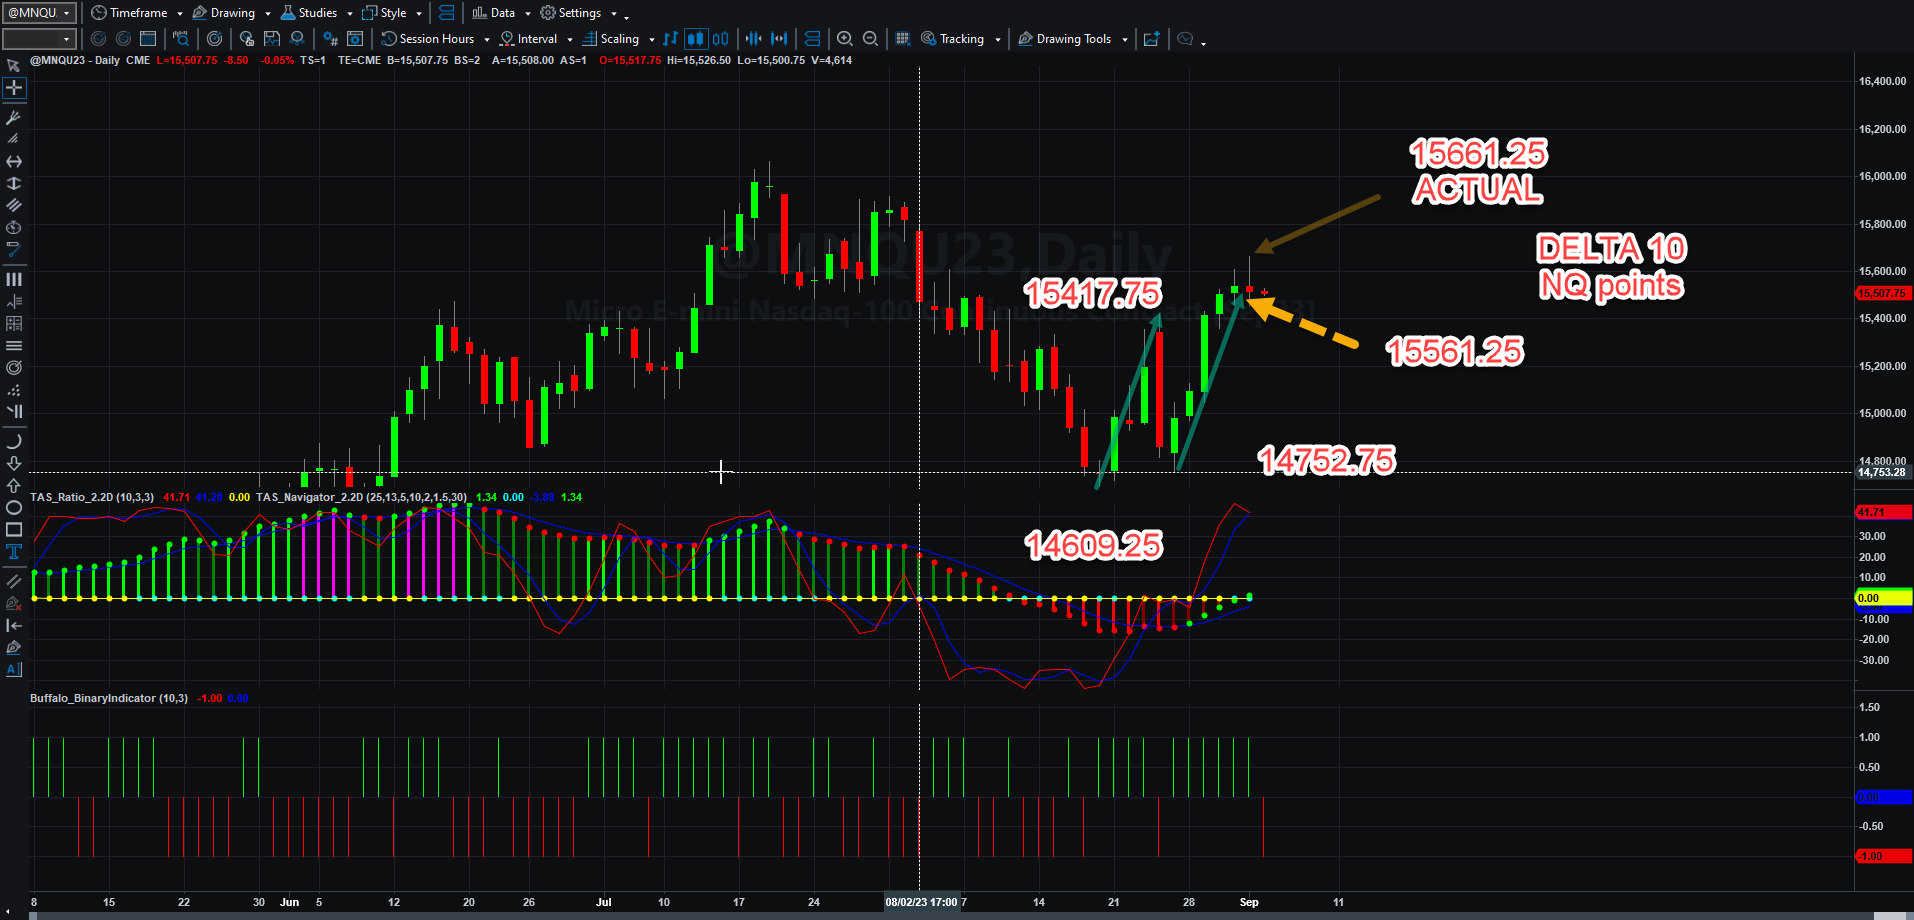
We will discuss this in more depth in Part 3 of Setting Up The Trade and in other sections of that series as well.
The conclusion one can make is that it still appears that MNQU23 is at an inflection point that probably gets resolved in the coming month. We will simply have to watch chart action with regard to gaps in commercial holdings, driven by volume of buyers and sellers to determine reasonable trading targets.
For those of you in the USA, have a restful Labor Day. To the rest of you, have a greatly productive and profitable week!

