



Any change is resisted because bureaucrats have a vested interest in the chaos in which they exist. - Richard M. Nixon
Human sacrifice, dogs and cats living together… mass hysteria! - Bill Murray as Dr. Peter Venkman in “Ghostbusters” (1984)
I had a busy day yesterday that was part of a busy week. when I saw this image of a burning Moscow refinery, the result of another effective Ukrainian drone attack. My first concern was of hypersonic nuclear missiles flying over the EU and even in the USA, as we have armed NATO countries to perform this insanity. Then I saw this post on X, regarding the complete lack of usable crude oil from J.P. Morgan. This of course is fear porn from May, but when combined with strikes on Russian refineries and Saudi processing facilities, it gives the brokerage firms the change to rattle retail and institutional traders who might be sitting on the sidelines. The crisis in diesel fuel is much more critical, as you can see from this research, and that is detailed in this recent OilPrice article.
Add this to the combined effects of the Iran/US conflict, and the possibility of mobilization of China for perhaps a run at Taiwan as the year ends based on what I have read about China’s version of NDAA just passed in late August, and you would think the markets would really go nuts. Then when you see the political bilge from the UK hitting your screen, you think the world is about to end. Throw on top of that the noise about “killer AI” and hyper-scaling debt explosion, which I will discuss that later, but not today), you would think the markets would burn down.
But what did we see in NASDAQ volatility?
The CBOE NASDAQ-100 Volatility Index (VXN)—the Nasdaq-100 equivalent of the VIX—closed at 19.29 on Friday, September 18, 2026. It was practically lifeless. One does not get excited about it until it exceeds 30. For that index and its futures, it is just another sunny day at the park. Read this link for a bit of background on VXN.
To save time, watch this video. I will pull key points from it below the video. Things seem bullish on the surface, but beneath it, it could be getting a little shaken.
The time stamps are:
0:00 to 4:11 Monthly Chart of MNQZ26
4:11 to 6:16 Weekly Chart of MNQZ26
6:16 to 6:51 Daily Chart
Monthly Chart 1 (Time symmetry not perfect, but price symmetry held up)
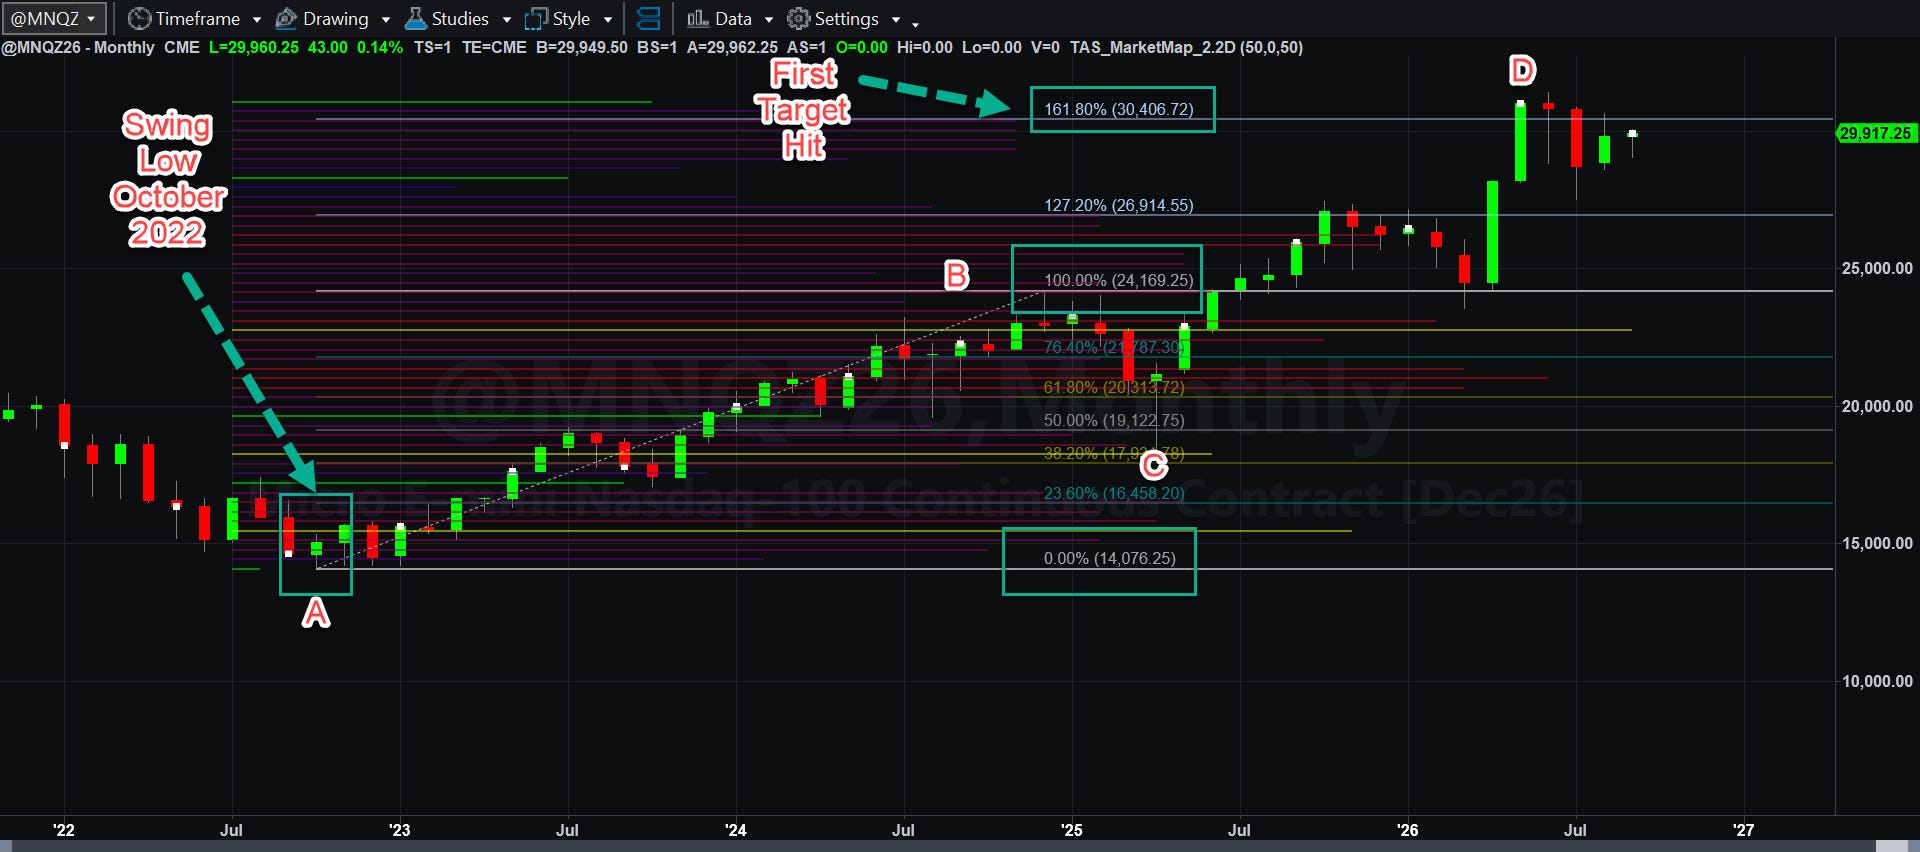
The secondary bullish MNQZ26 secondary target, assuming total price and time symmetry (which doesn’t happen perfectly, but tends to follow the price action over time) looks like this (33323.50):
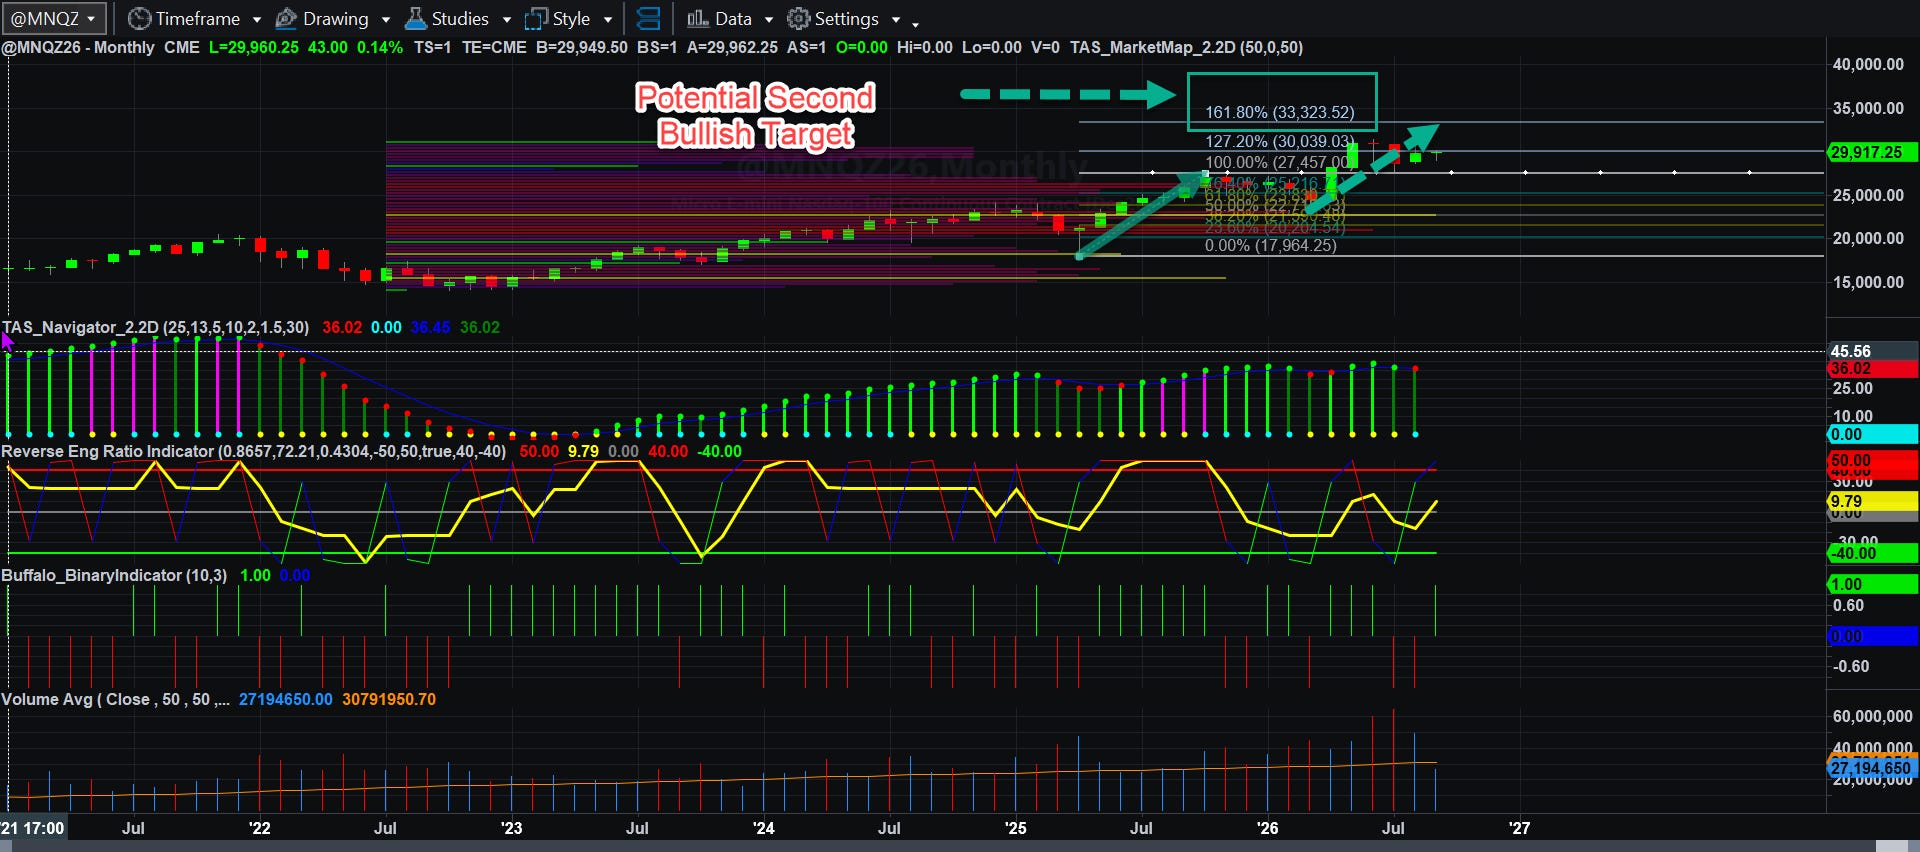
I will avoid discussing bearish targets today (though you have seen the discussion of it for the most recent contract after this one (MNQU26) in a previous post. I will discuss them when I see a change in the price action.
What bothers me the most is that volume dearth has extended beyond Labor Day, and that even with all the global tumult, things are rather quiet. As long as the free or nearly free money (now a bit less free now that rates at the short end of the Treasury market are rising, as long as the printers at the Treasury are running, markets will accept them and will continue higher, regardless of what earnings look like. Stocks for the individual and institutional investor are still the only game in town.
What About M2 Growth, GDP Growth, and Inflation?
According to the Federal Reserve, the latest official U.S. M2 (seasonally adjusted, M2SL) through July 2026 is $23,218.0 billion. The 12-month growth rate ending July 2026 is 5.41%. Year-to-date 2026 growth (December 2025 to July 2026) is 3.86%, which annualizes to roughly 6.7%. The combined period from mid-2025 through July 2026 shows similar mid-single-digit annualized growth. If you have ever followed me on X, my own personal inflation number is around 7% based on the bills. That seems to be consistent with what we see in M2. (if you want to see the calculations, using the Fed’s own data, look here.)
The operative question is, can the US economy, given its propensity to spend money at insane levels, outgrow this growth in M2 and inflation?
Underneath that question, is the US government spending at Covid-pandemic-era levels? I will quote you Grok’s answer below, but Grok’s answer does not fully explain what is happening in the macro-world of interest rates and Federal government policy:
No. Congress is not spending at COVID-19 pandemic-era levels when measured as a share of the economy or in terms of emergency supplemental appropriations. Nominal dollar totals are now higher than the 2020–2021 peaks, which is expected after several years of inflation, economic growth, population aging, and sharply higher interest costs on the national debt.Key comparisons (fiscal years)Fiscal year runs October 1–September 30.
FY2020 (peak COVID year): Outlays $6.55 trillion, or 31.3% of GDP. Deficit $3.13 trillion (15% of GDP). Massive one-time emergency spending (CARES Act and related packages) drove the spike.
home.treasury.gov
FY2021: Outlays $6.82 trillion, or 30.5% of GDP. Deficit $2.77 trillion. Continued large COVID-related outlays (American Rescue Plan, extended unemployment, stimulus payments, etc.).
home.treasury.gov
Pre-COVID baseline (FY2019): Outlays about $4.45 trillion, roughly 21% of GDP.
FY2025 (most recent completed year): Outlays $7.01 trillion, or 23.1% of GDP. Deficit about $1.78 trillion (5.8% of GDP).
cbo.gov
FY2026 (current year, ends September 30, 2026): CBO projected $7.45 trillion in outlays, or 23.3% of GDP, with a deficit around $1.9 trillion. Through August (11 months), outlays already reached $6.81 trillion.
fiscaldata.treasury.gov
Quarterly NIPA-style measures of federal spending as a percent of GDP peaked even higher during the height of the pandemic (over 40% in mid-2020) before falling. Recent quarterly readings have been in the 23–24% range.
ycharts.com
The 50-year historical average for federal outlays is about 21.2% of GDP. Current levels remain elevated relative to that long-run average and to the pre-2019 period, but they are well below the 30%+ pandemic emergency years. Why nominal spending is higher now:
Entitlements (Social Security, Medicare, Medicaid) grow automatically with demographics, healthcare costs, and inflation.
Net interest on the debt has risen sharply and now exceeds $1 trillion per year.
The economy and price level are larger than in 2020–2021, so the same programs cost more in current dollars.
Emergency-designated discretionary funding related to COVID has largely ended. CBO notes that non-defense emergency funding in recent baselines is far smaller than the hundreds of billions provided in 2020–2021.Bottom line spending has not returned to the extraordinary, temporary COVID-relief scale. It has settled at a structurally higher plateau driven by mandatory programs and interest costs rather than new pandemic-style stimulus. Deficits remain large by historical standards (around 6% of GDP) but are smaller than the 12–15% range of FY2020–2021.
Notice I highlighted that last sentence. That is the problem. We are paying interest ON interest now, and our interest payments are larger than our defense budget! As we continue to spend more, that interest expense will only continue to expand, and in real dollar terms, that figure will explode over time.
In terms of government outlays for 2026, Interest is the number 2 item, larger than the defense budget, and it will swiftly continue to grow as deficit spending continues to run at a 7% to 8% pace. Take a look:
Actual Outlays (Expenses) Through August 2026 by Budget Function:
These are Treasury figures for money actually spent (in millions of dollars). Timing shifts (e.g., some August payments moved to July because August 1 fell on a non-business day) affect monthly comparisons but not the year-to-date totals.
fiscaldata.treasury.gov
Social Security: $1,525,869
Net Interest: $1,016,966
Medicare: $979,300
Health (includes Medicaid and other): $925,698
National Defense: $876,163
Income Security: $645,230
Veterans Benefits and Services: $395,647
Transportation: $126,437
Administration of Justice: $99,369
Education, Training, Employment, and Social Services: $91,952
Community and Regional Development: $57,375
Natural Resources and Environment: $51,891
Agriculture: $51,013
International Affairs: $44,857
General Science, Space, and Technology: $36,244
General Government: $24,841
Energy: $18,398
Commerce and Housing Credit: –$10,490 (net)
Undistributed Offsetting Receipts: –$145,716
Total: $6,811,043 million ($6.811 trillion)
Revenues through August were $4.845 trillion, producing a year-to-date deficit of about $1.97 trillion. Major agency-level outlays align with these functions (e.g., HHS, SSA, Defense, Treasury interest, and VA account for the largest shares). Final September data and full-year actuals will be available after the fiscal year ends. For the most current official figures, see the Monthly Treasury Statement and CBO reports.
President Trump IS trying to deliver on growth items, and the poverty level is the lowest since it was first recorded in 1966. Jon Najarian discusses it here.
There is only one problem with this, and I don’t care Scott Bessent says, if you cannot outgrow that level of M2 expansion, your economy will eventually implode, and will result in hyperinflation in the end. I guess he’s a nice guy, but he was one of the gentlemen, along with George Soros and Stanley Druckenmiller who helped to collapse the Bank of England in 1992’s Black Wednesday (16 September 1992) event. The UK had to withdraw from the the pound from the European Exchange Rate Mechanism (ERM). It is a very large portion of his net worth.
How strong is forecast US GDP growth as we move into 2027? If you believe the Fed, it is in the mid-to-high 2% ranges. If you believe Elon Musk, it might be closer to 4%. Even that cannot overcome a 6+ to 8% M2 expansion!
Dream all you want, but the fantasy will die in your wallet thanks to the criminal rabble of both divisions of the Uniparty in Congress and the Senate!
The only way to stop this insanity is to both dramatically reduce spending and back the dollar again with a specie of some kind (gold or some other basket of scare and valuable commodities). The free-floating fiat toilet paper must come to and end, and NOW. Cutting rates to zero, as President Trump has suggested, is one of the most moronic things I have ever heard an American politician say (though you and I could both write a novel the size of Marcel Proust’s “In Search of Lost Time” (a novel of 1.2 million words) about asinine things politicians say. Mine would be much longer than yours because I would color the language with expletives.
I can get into the other extrinsic factors like the reversal of the Japanese Yen carry trade, but then this post would become as long as “In Search of Lost Time”. Our bond market is crippled by bad and perhaps criminal fiscal, spending and monetary policy, and we are going to reap the whirlwind unless it is corrected soon. It may involve revaluing gold prices to erase the losses, but the purchasing power of the dollar would collapse dramatically.
Valuation of QQQ (Nasdaq 100)
You can read the data from barchart.com. Valuations are not excessive but elevated. The scary part is that it is a market weighted index with the top 10 stocks account for roughly 48% of the index:
NVIDIA (NVDA): 8.5%
Apple (AAPL): 7.9%
Microsoft (MSFT): 5.9%
Micron (MU): 4.9%
Amazon (AMZN): 4.3%
AMD: 3.9%
Alphabet Class A (GOOGL): 3.2%
Meta (META): 3.2%
Alphabet Class C (GOOG): 3.0%
Tesla (TSLA): 2.9%
NVIDIA is deeply involved in the AI hyperscaler chip business, and seems to have some rather questionable accounting methods relative to sales. All of the top 7 have something to do with AI expansion, and if the financing looks impossible to overcome by earnings. That is another risk factor. We will simply have to watch how it all goes.
The bulls currently hold the earnings potential. The bears hold the intrinsic and extrinsic economic, fiscal, monetary, and global chaos potential. Since I trade at the margin, I really don’t have a dog in the fight except that I need volatility to make money. If you are long technology stocks, now might be a good time to review which stocks will serve your short-term and long-term return objectives. Be prepared to cut bait if things get nasty, but also be prepare to fish for the values you find for the longer run when there is blood in the streets.
Other than that, I would simply sit out on the porch and carefully consider your next moves!
Thanks again for supporting the Buffalo Trader’s Writing Desk! This will be the last free one for awhile, but I expanded the length of this edition to give you an idea of what I can cover on an (at least) semi-monthly basis. If this Substack grows, I will expand coverage of other items including stocks, futures, and forex. It likely will never be as data-packed as The Buffalo Trader blog once was, but if I can design ways to generate that kind of data again to some extent, I will include it!
Have a fantastic week!