

There are two hourly charts I want you to see. The first is the chart with volume and price spreads included, and the other is the price charts only with Fibonacci levels for MNQZ22.
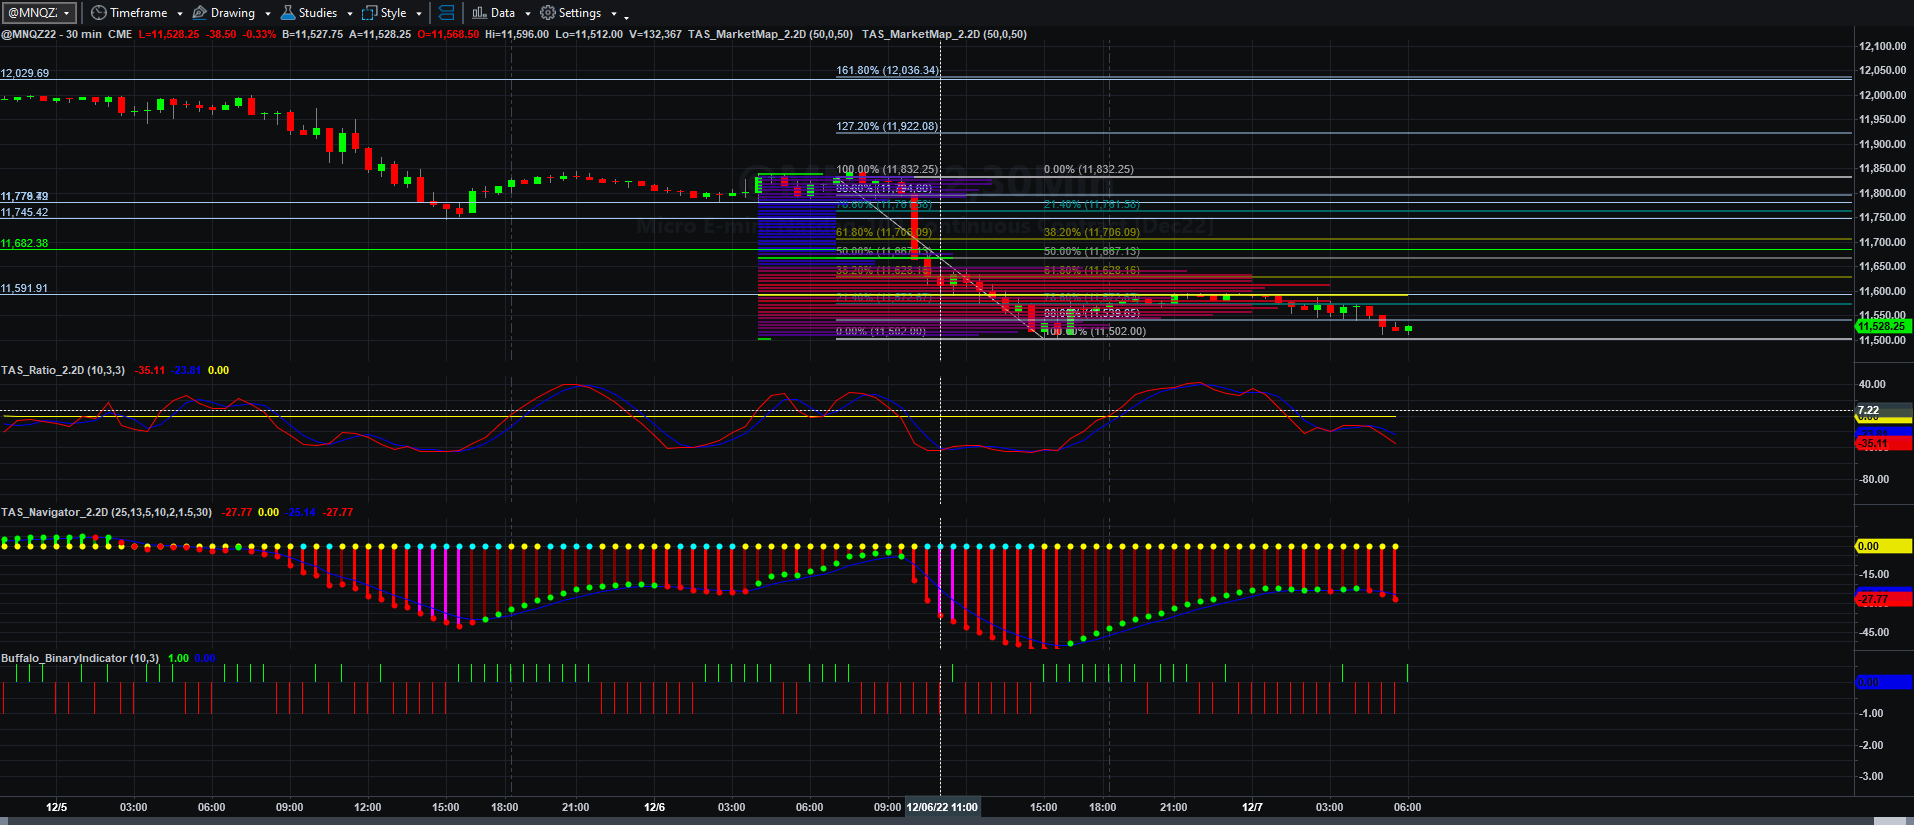
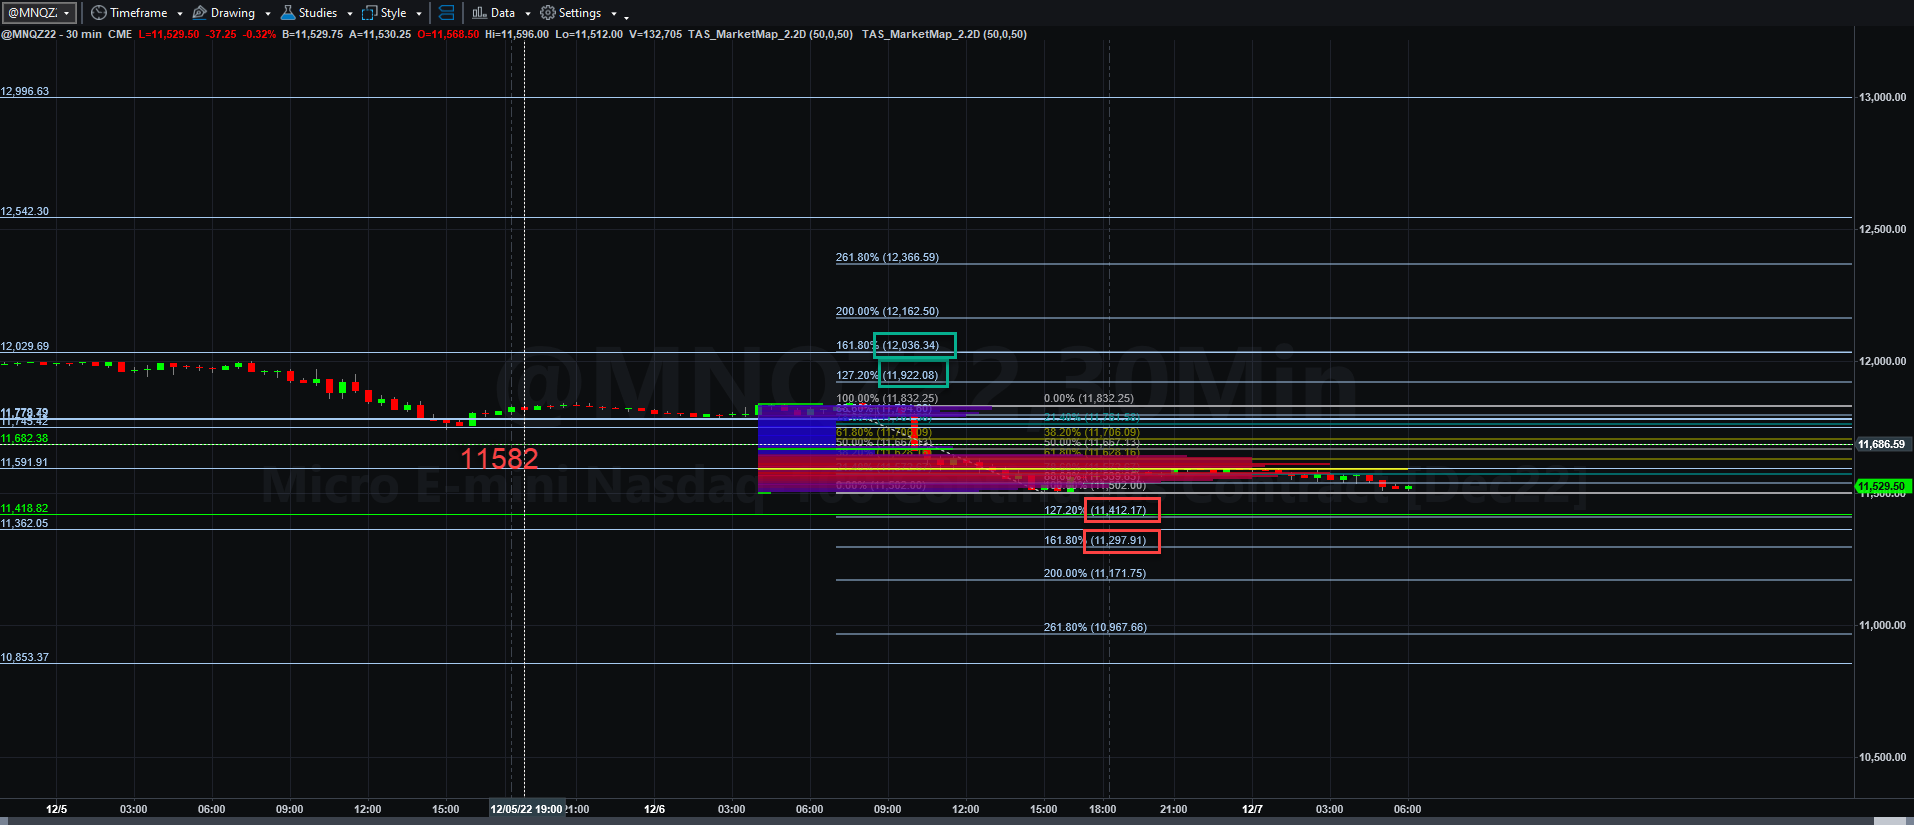
I apologize for the rather random banter of that video yesterday, but I demonstrated why what actually DID happen yesterday COULD have happened as sellers became active when negative news hit about technology earnings ( among other things).
I have no idea what will happen today. All I can say is that if we do not exceed 11582, that odds are we could travel back below the swing low around 11502 and head back to a previous VWAP line at 11412.25 or lower. If we can exceed 11582, then odds are decent that we could take a shot at a previous VWAP line of 11778.50 to perhaps 11832.25 and even 11922 over the next couple of days if buyers get active today.
Industrial productivity is probably the big number that hits today, but I doubt it will rattle markets. NO ONE KNOWS FOR SURE IN THE NASDAQ FUTURES CASINO, AS WE SAW YESTERDAY.
I did make up for Monday’s boot losses by capturing about 2/3 of the short move in the early market as my target was hit. If nothing shows up that meets my entry criteria, I will move on to the business of the day, which is quite extensive of late.
More will be coming soon.
Economic Data courtesy of Econoday dot com
MBA Mortgage Applications
7:00 AM ET
Productivity and Costs
8:30 AM ET
EIA Petroleum Status Report
10:30 AM ET
4-Month Bill Auction
11:30 AM ET
Consumer Credit
3:00 PM ET