

There will be no video this week as I had technical problems with using the Epic Pen tool in the video. I will go chart by chart into what is happening currently and what could be the outcome. What I want you to come away with is an understanding of price structure and how it relates to market action for MNQZ22. Anyone of these scenarios is possible, but it is important to understand that in Harold N. Garley’s world, it was important to do the work before he took the trade. The reason for that was to understand what to do if the trade went against him. It’s called “risk management”.
Let’s do monthly, weekly, and daily analyses.
Monthly Analysis of MNQZ22
I want you to see something you can find in a book by Arthur Skerew. (I get no compensation for that link. It is a great book, one that even Linda Bradford-Rashke recommended, long after I purchased my copy.)
Take a look at the monthly chart below using Sklerew three tops rule of drawing a downtrend line:
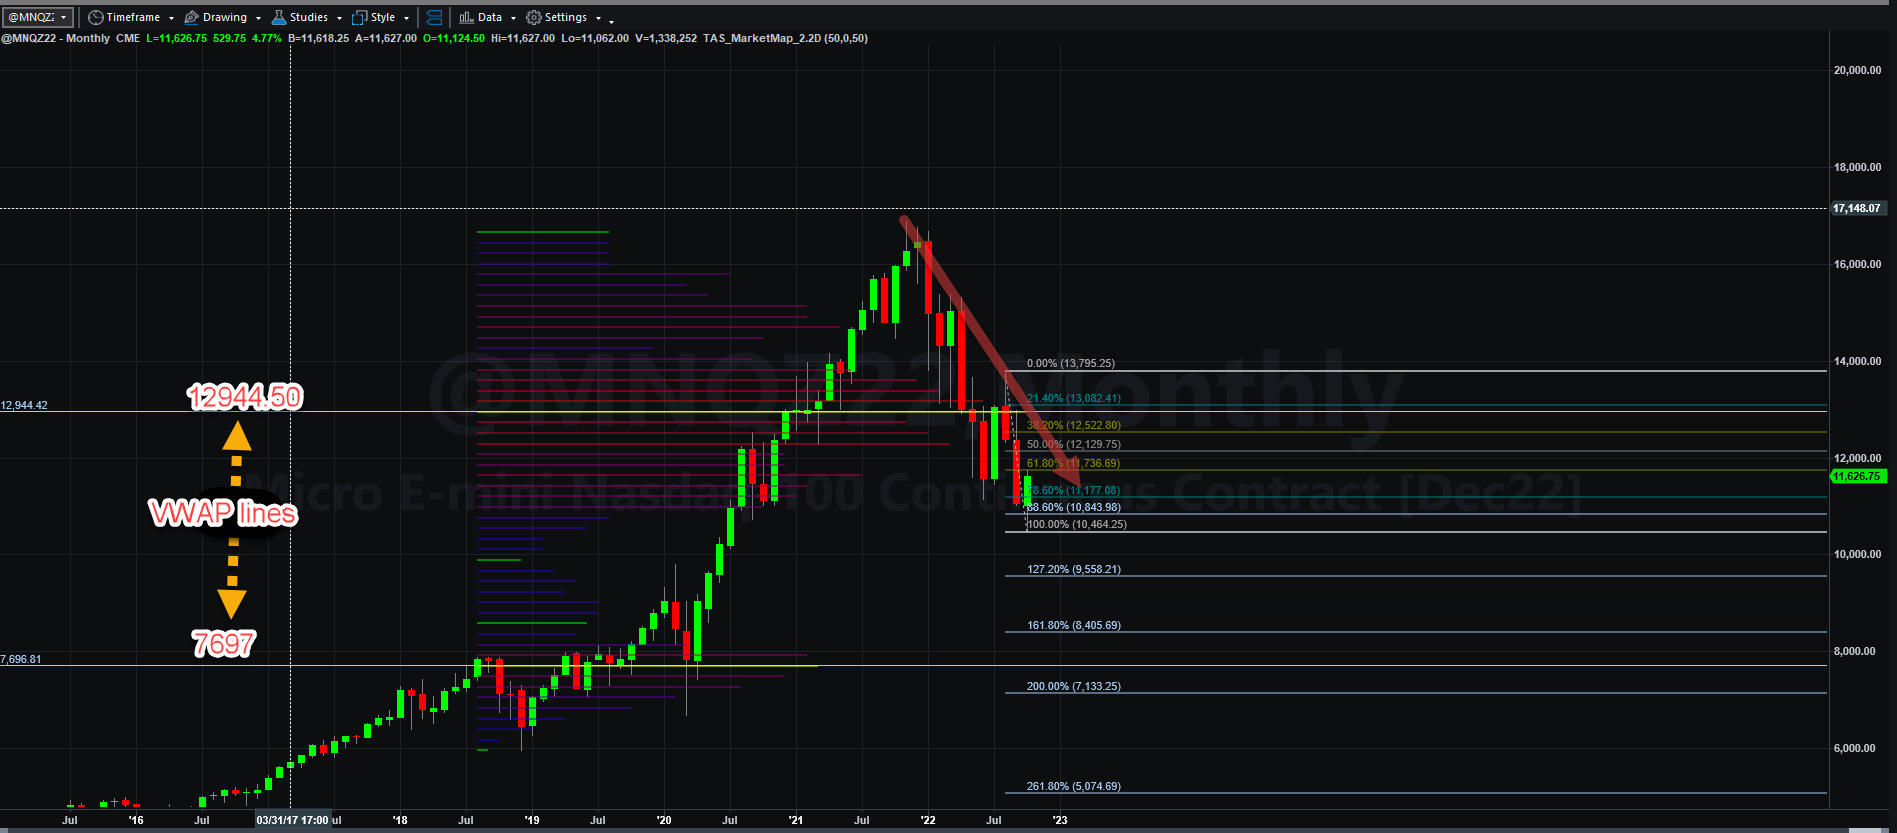
Even though there might have been a slight penetration on the second dot, that dot was NEVER CLOSED ABOVE IT on any bar. I love everyone’s opinion, but you are STILL IN A DOWNTREND.
Having said that, on this monthly chart, the October monthly bar, which will officially end on Monday, Halloween 2022, we may still end up with a bullish bar that will potentially be the beginning of a bullish pivot that will lead to a countertrend rally.
Under a bearish assumption that the price will NOT exceed the 38.2% retracement line at 11736.70, then price symmetry would suggest a target low on the monthly ( at least near price support) of 8405 is possible:
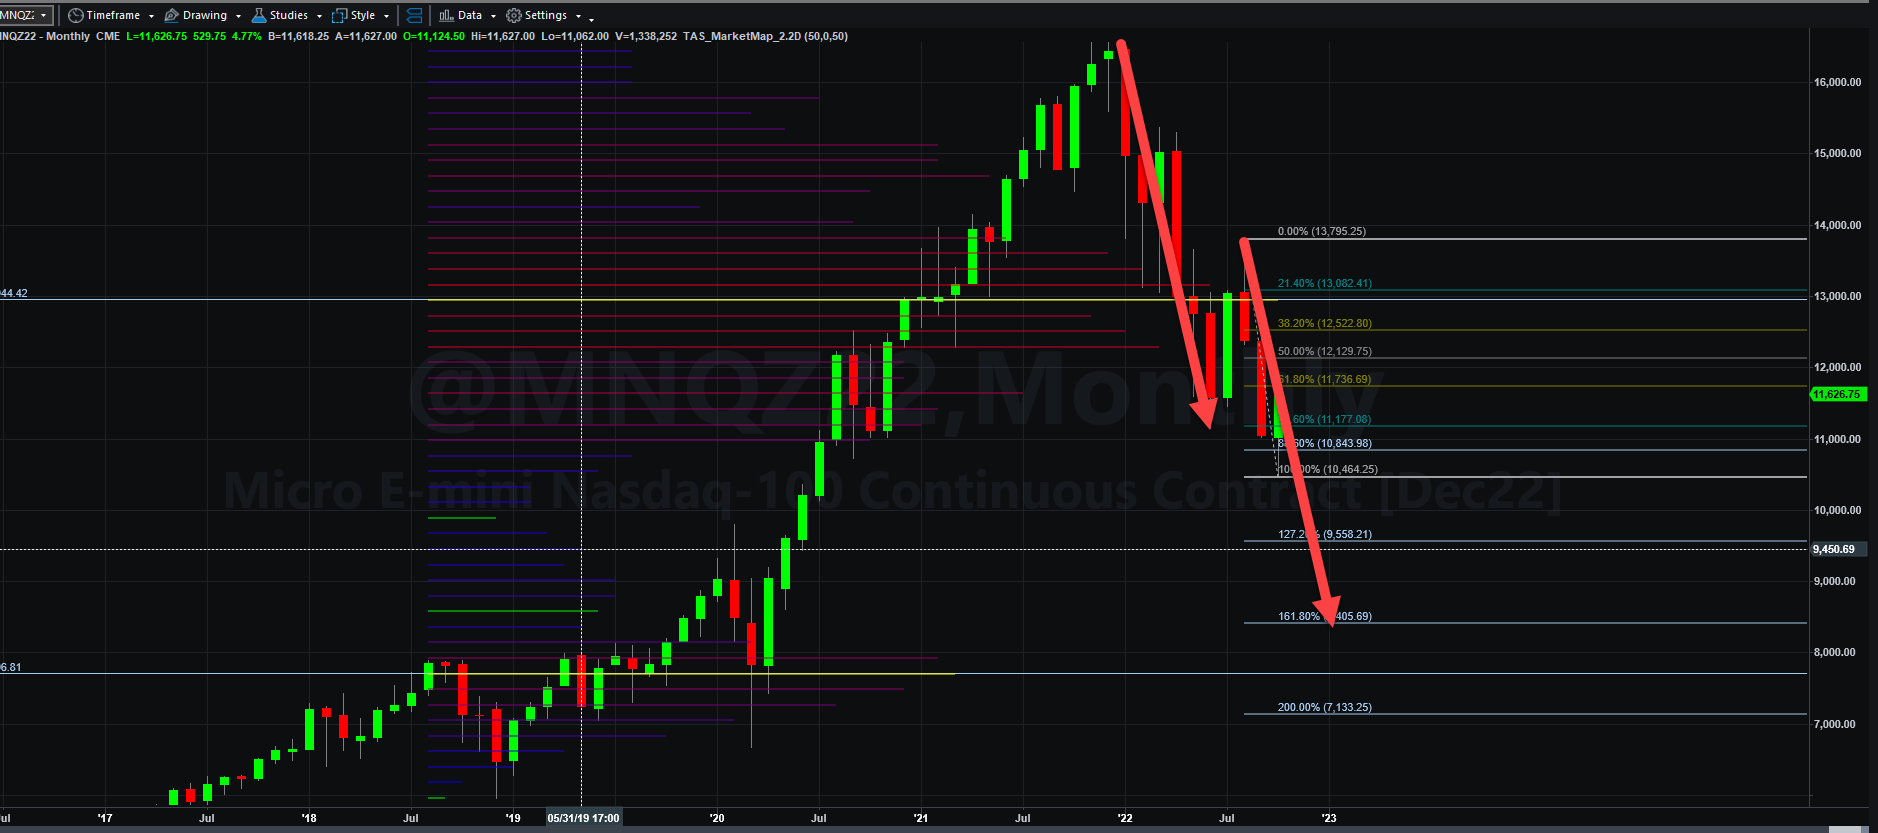
Does that mean that is where we will go? NO. Anything is possible, but let’s dive down into the weekly charts to understand what the options might be for a countertrend rally.
Weekly Analysis of MNQZ22
If you accept the chart above as the only alternative, the first weekly bearish scenario plays out with more evidence of the primary bear trend in place:
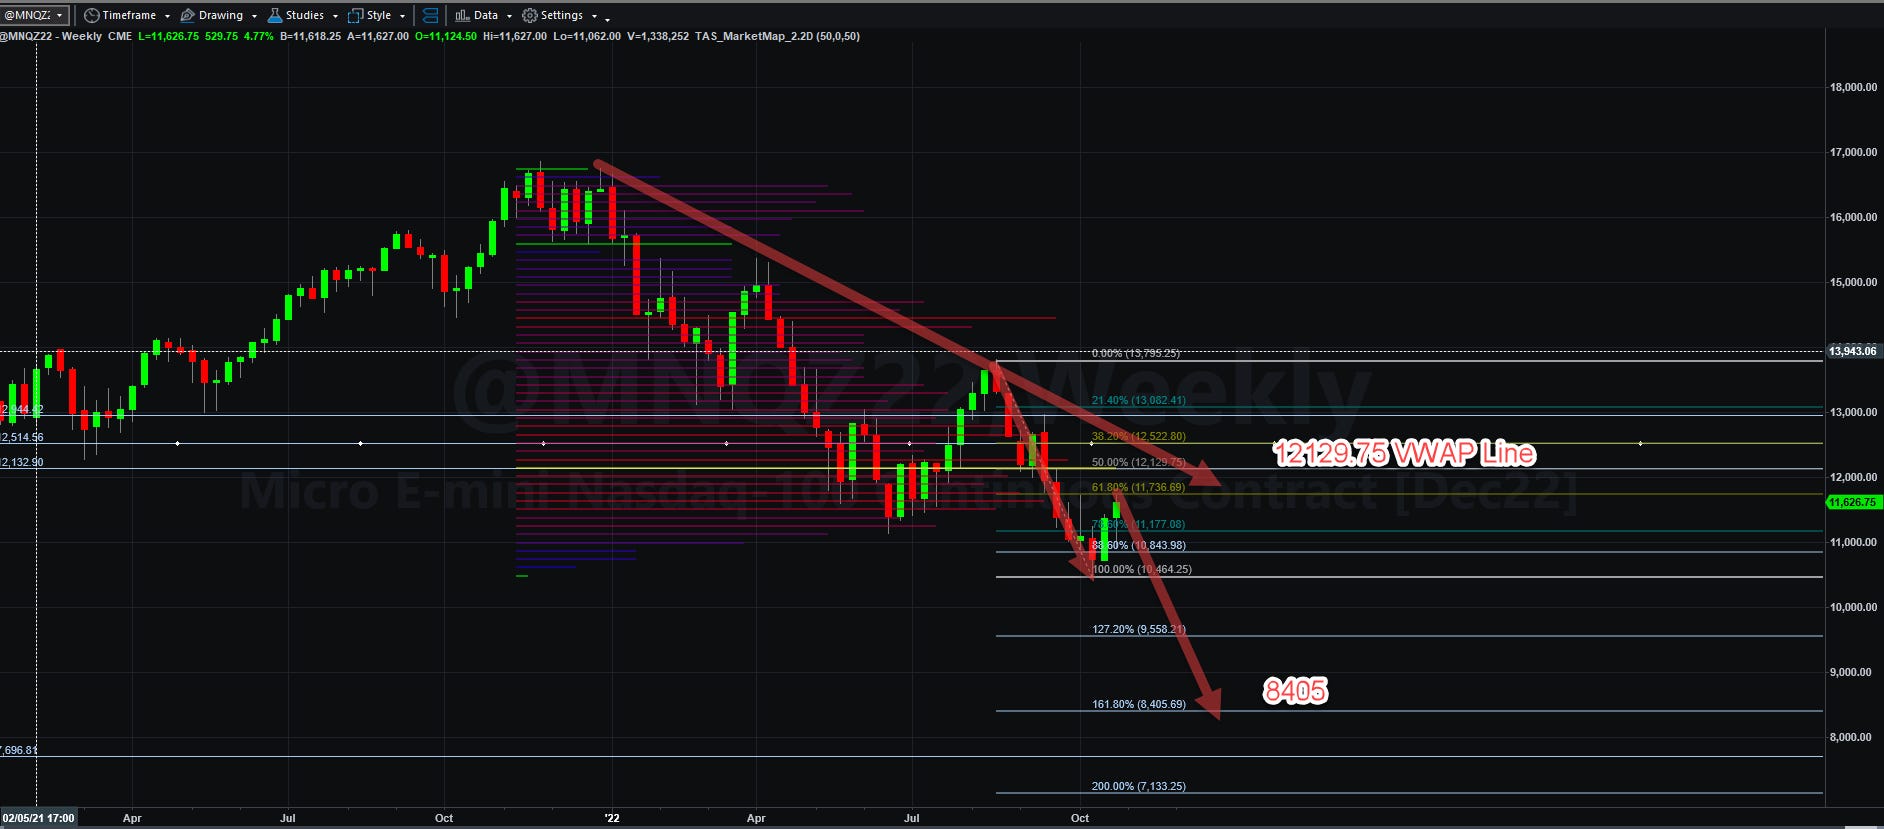
What you see above happens if a 38.2% retracement fails upon its completion. What happens if the rally runs back to the trend line, which is equal to the 61.8% retracement, and then fails? This would be a likely outcome:
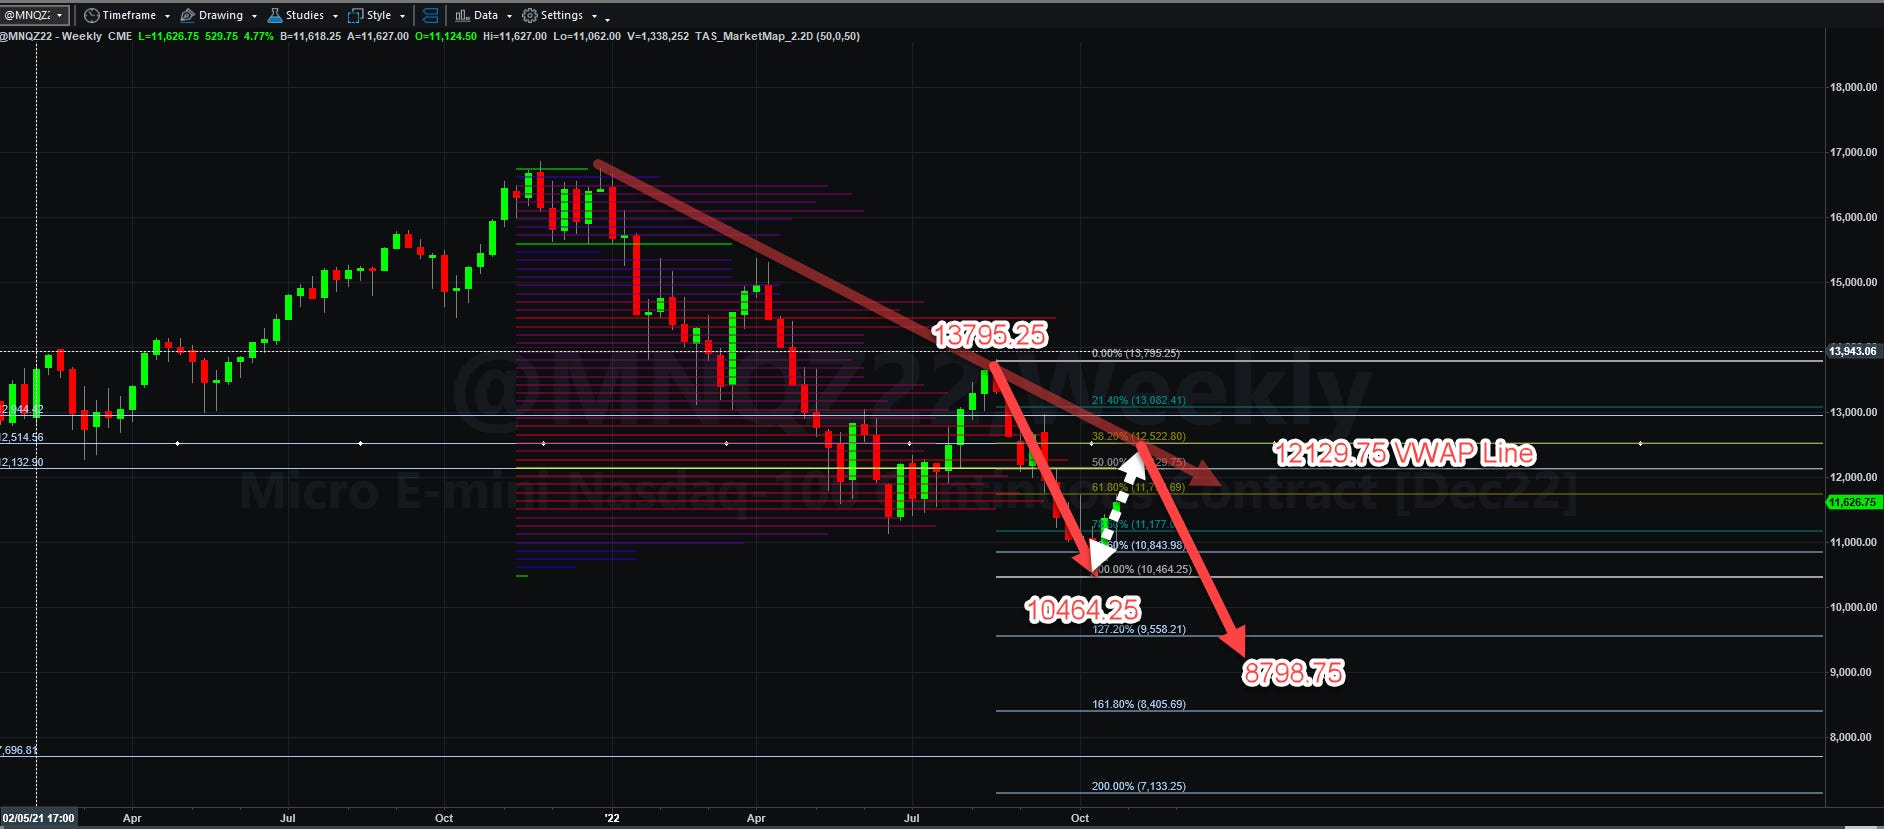
It would be a trip to 8798.75, which is quite near the previous forecast last week of 9088. If MNQZ22 cannot break through that trendline, that could be a highly probable result of a failed rally.
Now let’s go to the daily analysis.
Daily Analysis of MNQZ22
Based on price symmetry and the fact that volume at the end of Friday seemed to support a rally, we could see the target very near the 50% retracement of the last daily downswing at around 12193. We will know if this begins to work out as Asian markets open tomorrow evening (October 30, 2022).
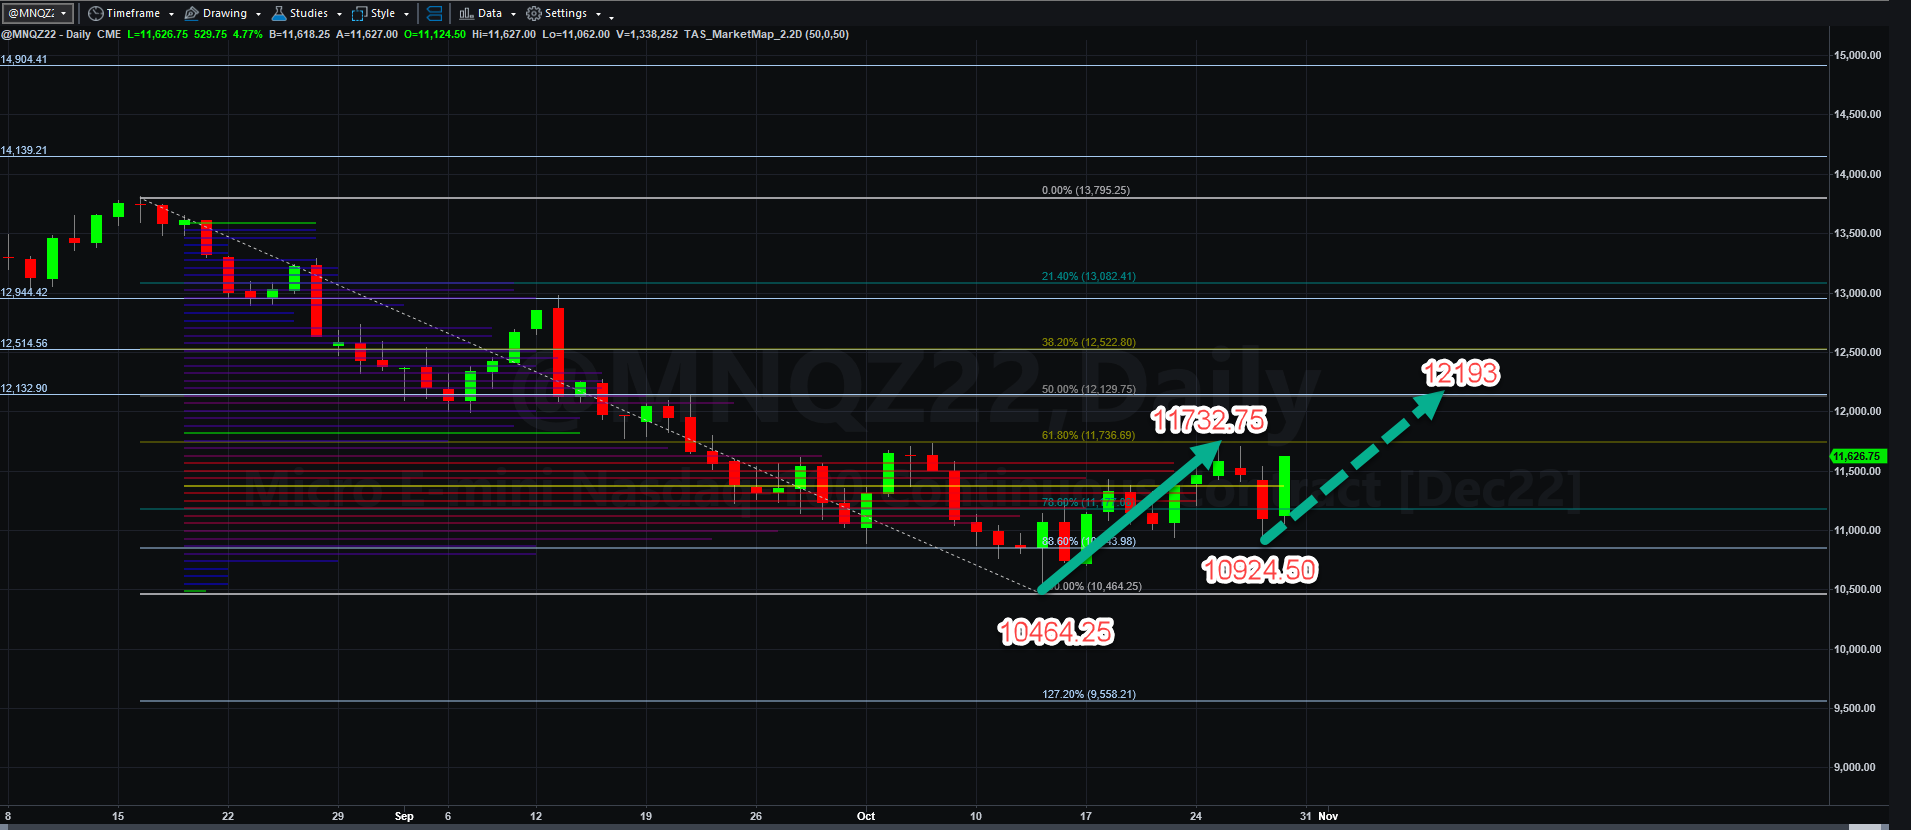
If it does not, then one of the two bearish scenarios presented in the bearish outcomes shown in the weekly charts could very well be the new bearish targets of this bear market.
My Conclusions
I still think we are participating in a bear market rally that will be extinguished around that VWAP line at 12129.75 or perhaps one as high as even 13082.75 before we see a continuation of selling.
When I see stocks like AAPL, META, and AMZN get hammered over earnings concerns, and that consumer confidence is taking a hit over inflation for staple items like food and energy, I think earnings across the board will suffer, even if we have a temporary rise in GDP as we had over the last month.
Supply chain disruptions are probably also coming as a result of “Joe Biden’s Clown World” energy policies and his destruction of the petrodollar. Diesel fuel and our strategic petroleum reserves are both nearly empty now, with no concrete plans to replace them. This will hurt all elements of the economy, including technology represented in the NASDAQ. Energy prices are going to spike for consumers and for business, not just here, but in areas of critical industrial production like the EU, where natural gas shortages will become even more restricted in 2023.
Anything can happen, but I think bulls need to be particularly cautious about deploying capital long for any short-term gains. If you do anything, you need a solid trade plan that has been tested.
That is it for now. I will get a video out on seemingly algorithmic trading action shortly.
As always, THANK YOU FOR SUPPORTING THIS BLOG!