

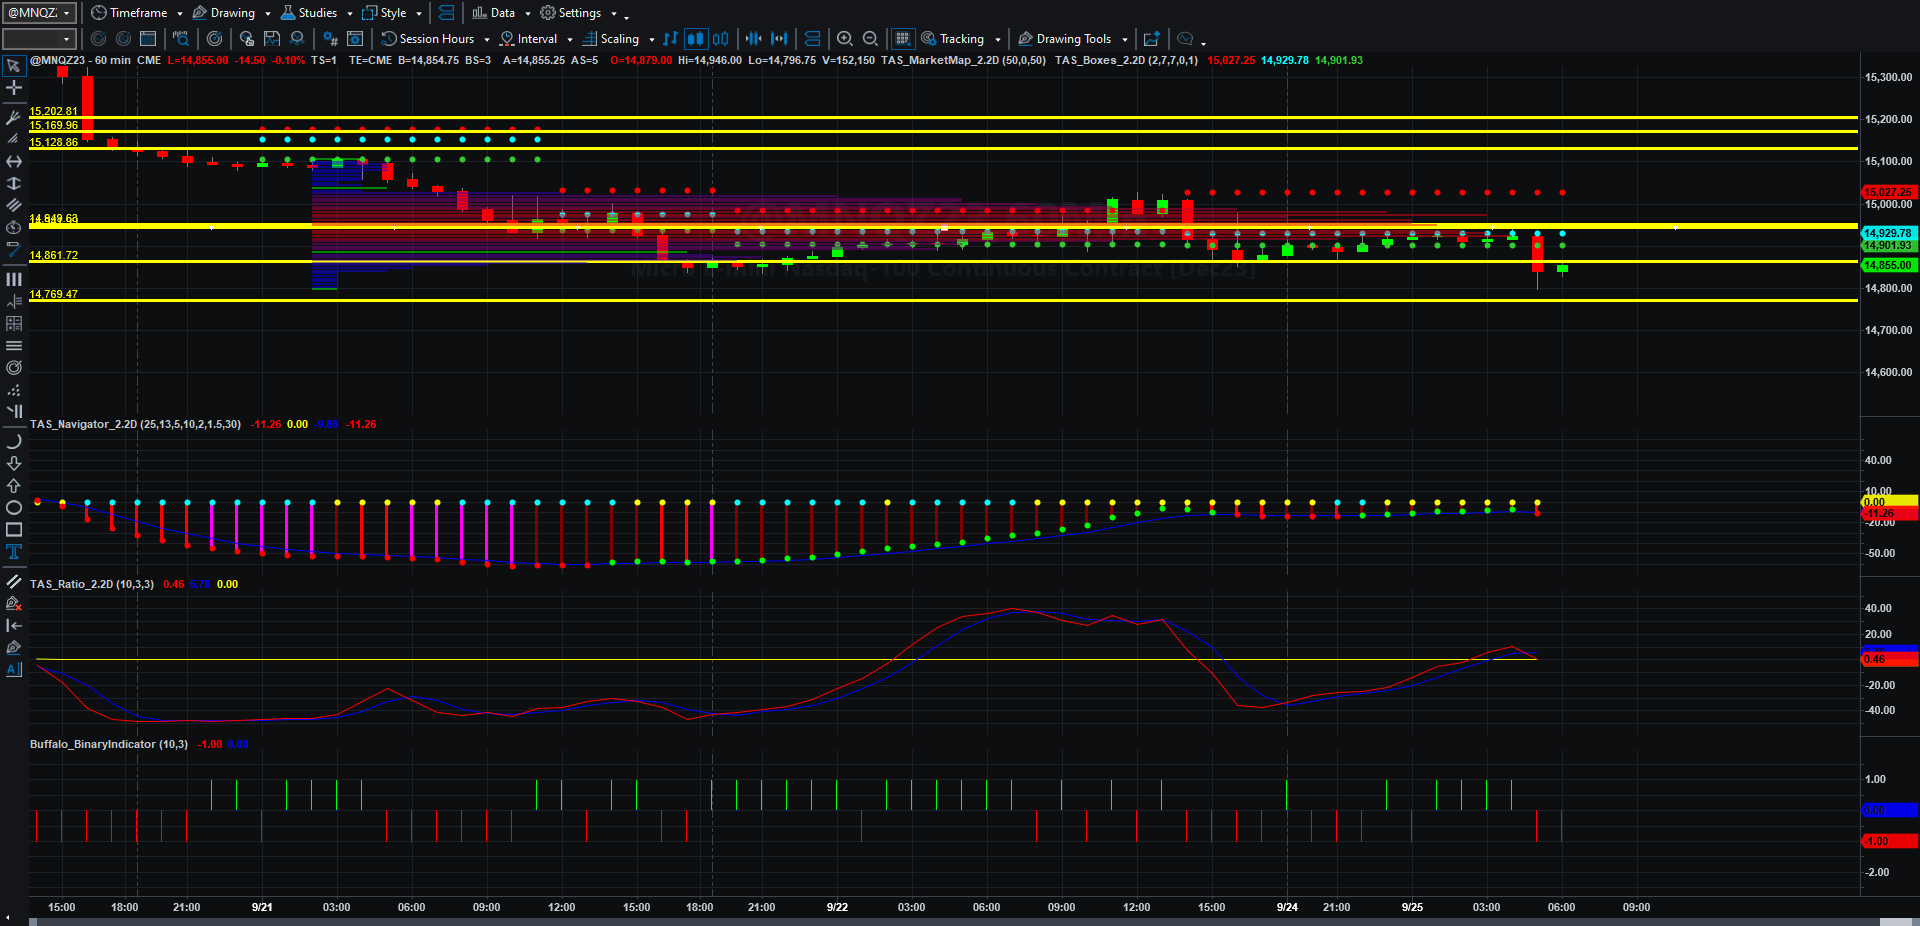
Price, Price Spread, Lagged Price/Volume Spread, and Binary Price/Volume Indicator
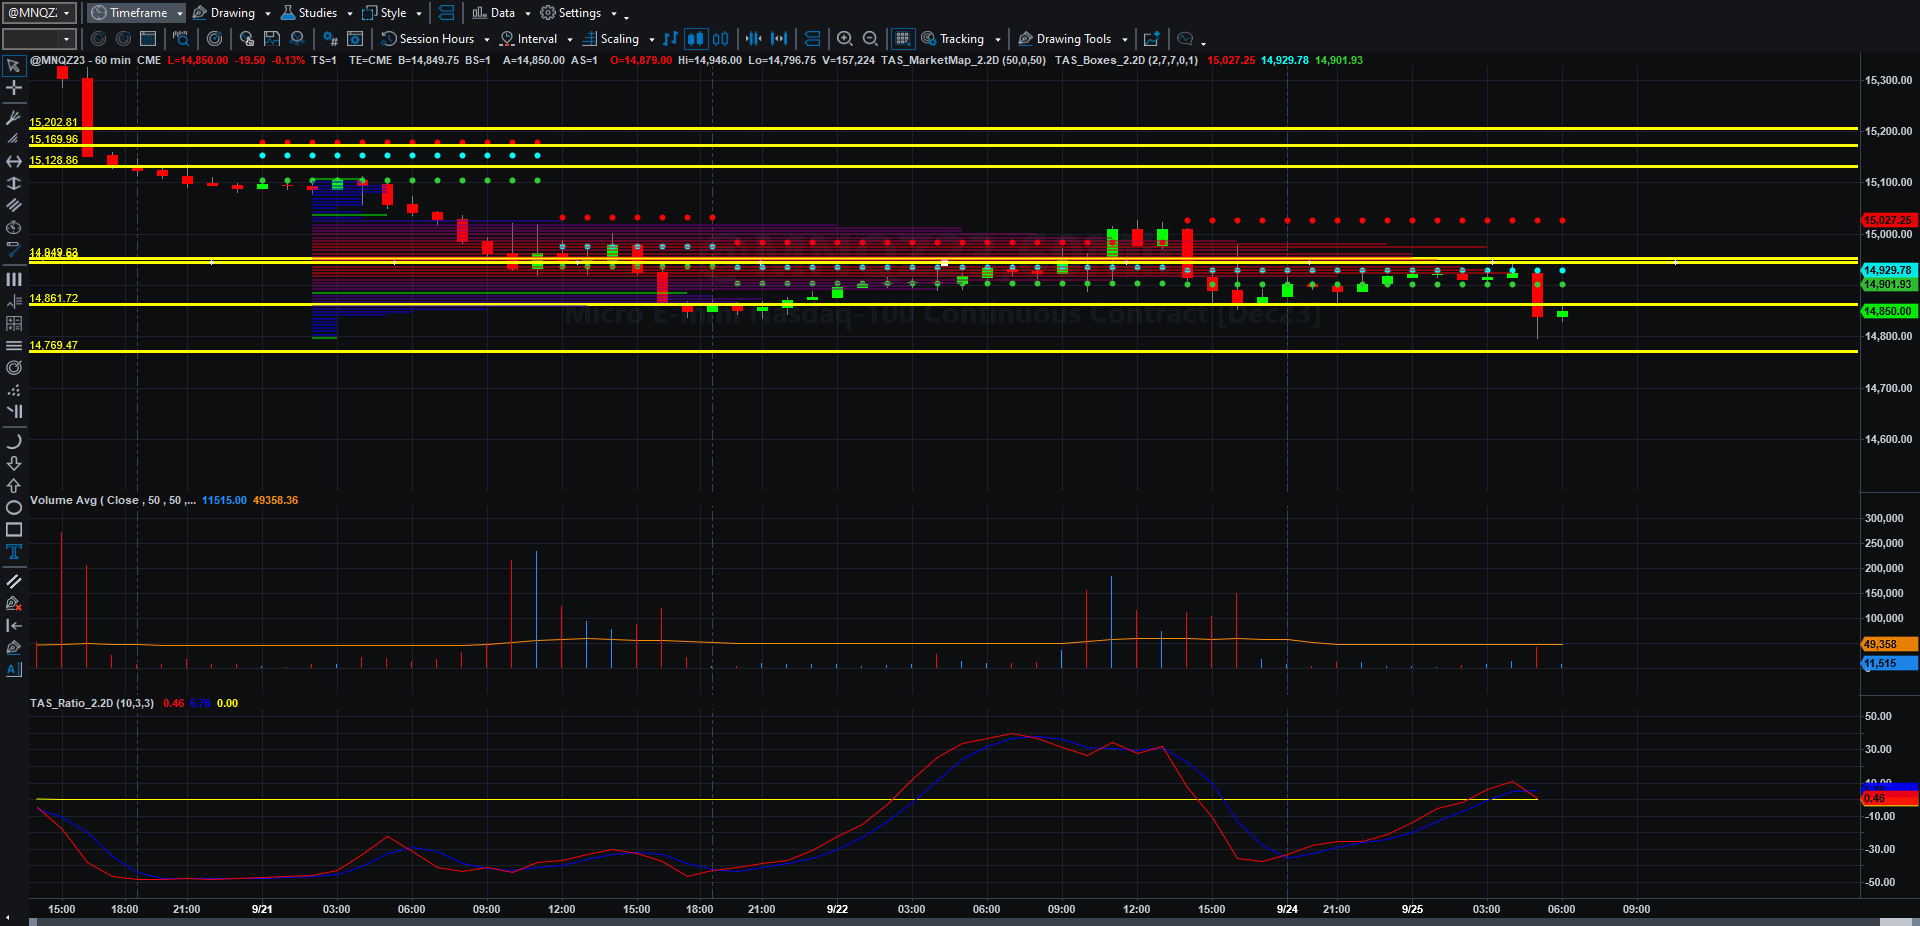
Price and Total Volume With 50-period Moving Volume Average
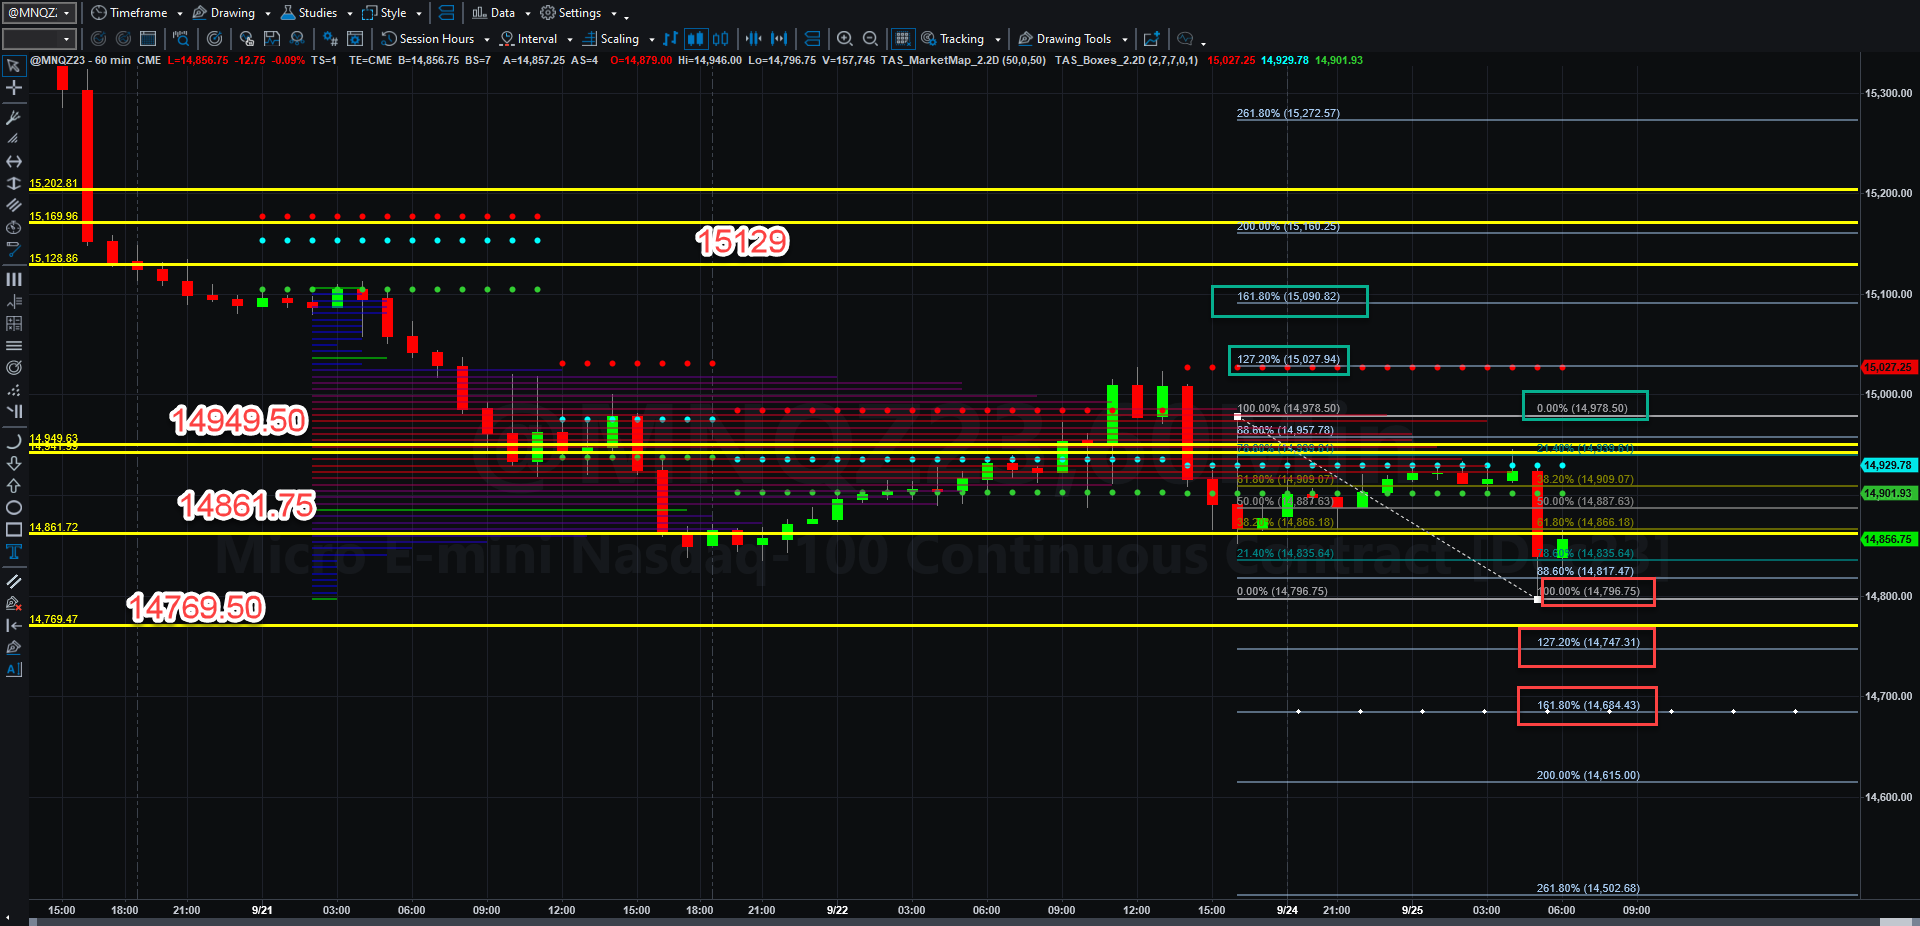
Fibonacci Price Scale With Targets
Sadly, some Substack upload issues and problems with not just one but TWO browser platforms will force an abbreviated write-up. Fortunately I have created a template to simplify production and publishing if things screw up like they did this morning.
I have written extensively about signals of recession, but it is very hard to see headlines like this piling up and slowing manufacturing growth as we saw last week and hear Gramma Yellen talk like this.
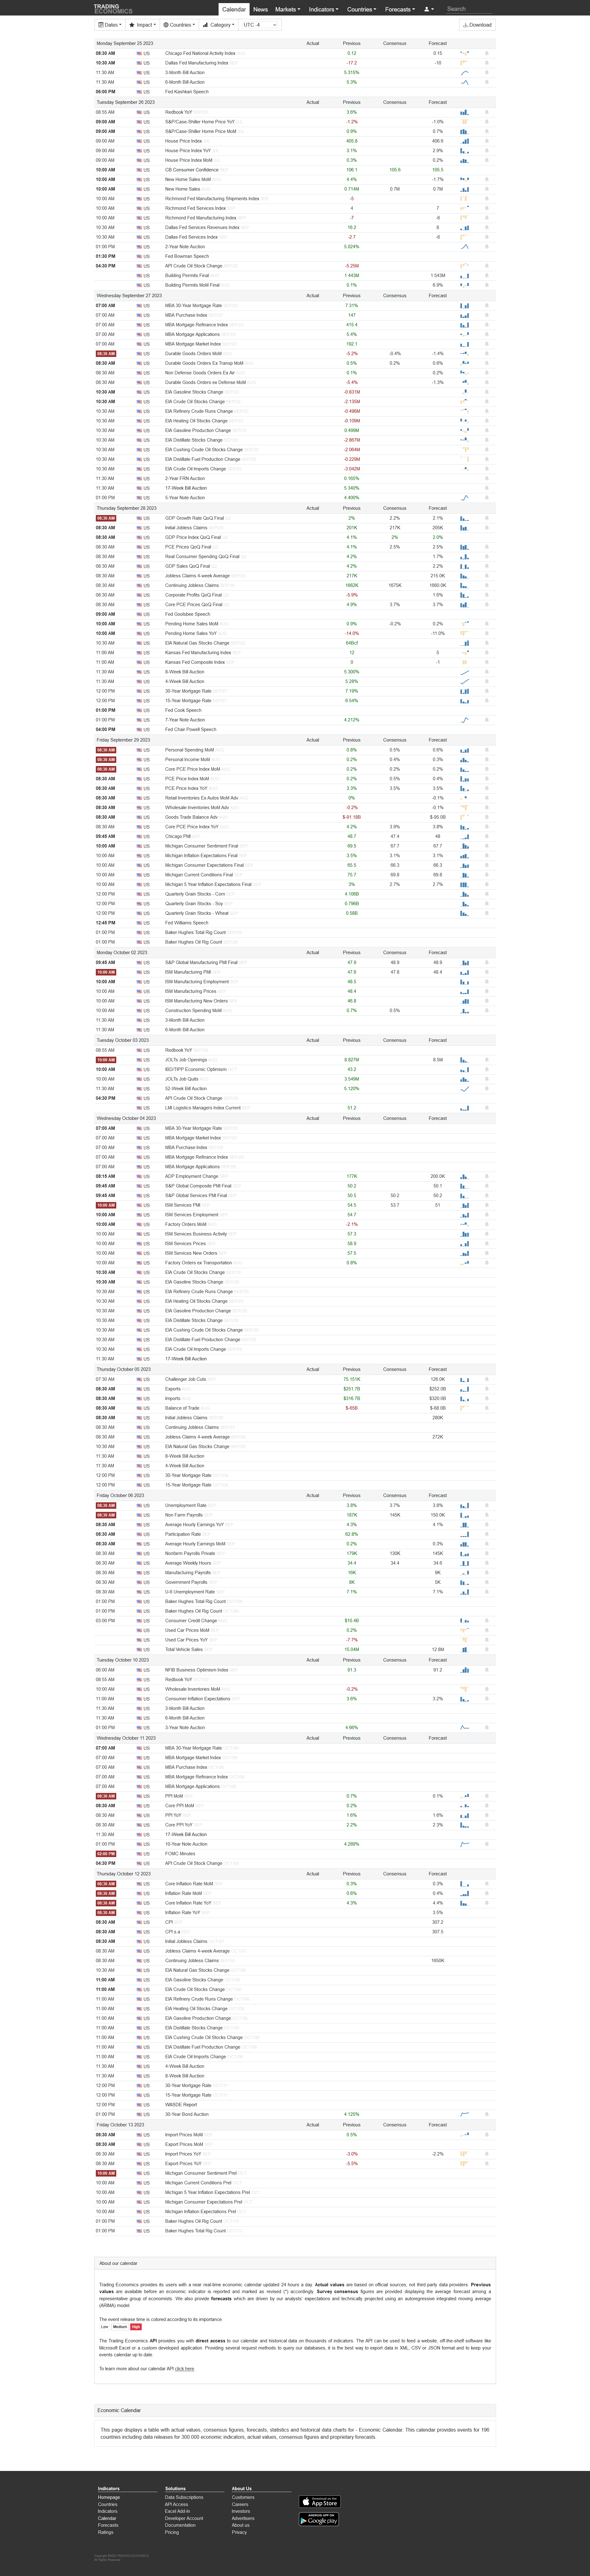
We will get a ton of evidence this week in durable goods data, GDP growth, and all the PCE inflation data this week. Stay tuned and wear your riot gear just in case.
Let’s get to the charts.
If MNQZ23 can rally above 14949.50, it has a high probability of taking out 14978.50 and rallying to 15028 and even 15091 by Tuesday. If not, then there is a quick trip in the opposite direction as it could be an equally short trip back to TODAY’S swing low of 14796.50 to 14747.25 and 14684.50 by Tuesday.
I managed to pick up 12 NQ points per contract on the short side on Friday and left the building before the real action began. As requirements of the other businesses change my schedule, I may again be able to trade a little later in the day, but time will tell.
That is it for today’s abbreviated session. Have a profitable and happy Monday!
Today’s Economic Data Courtesy of Trading Economics dot com. Be sure to refresh the date at the top left.
Great analysis!!