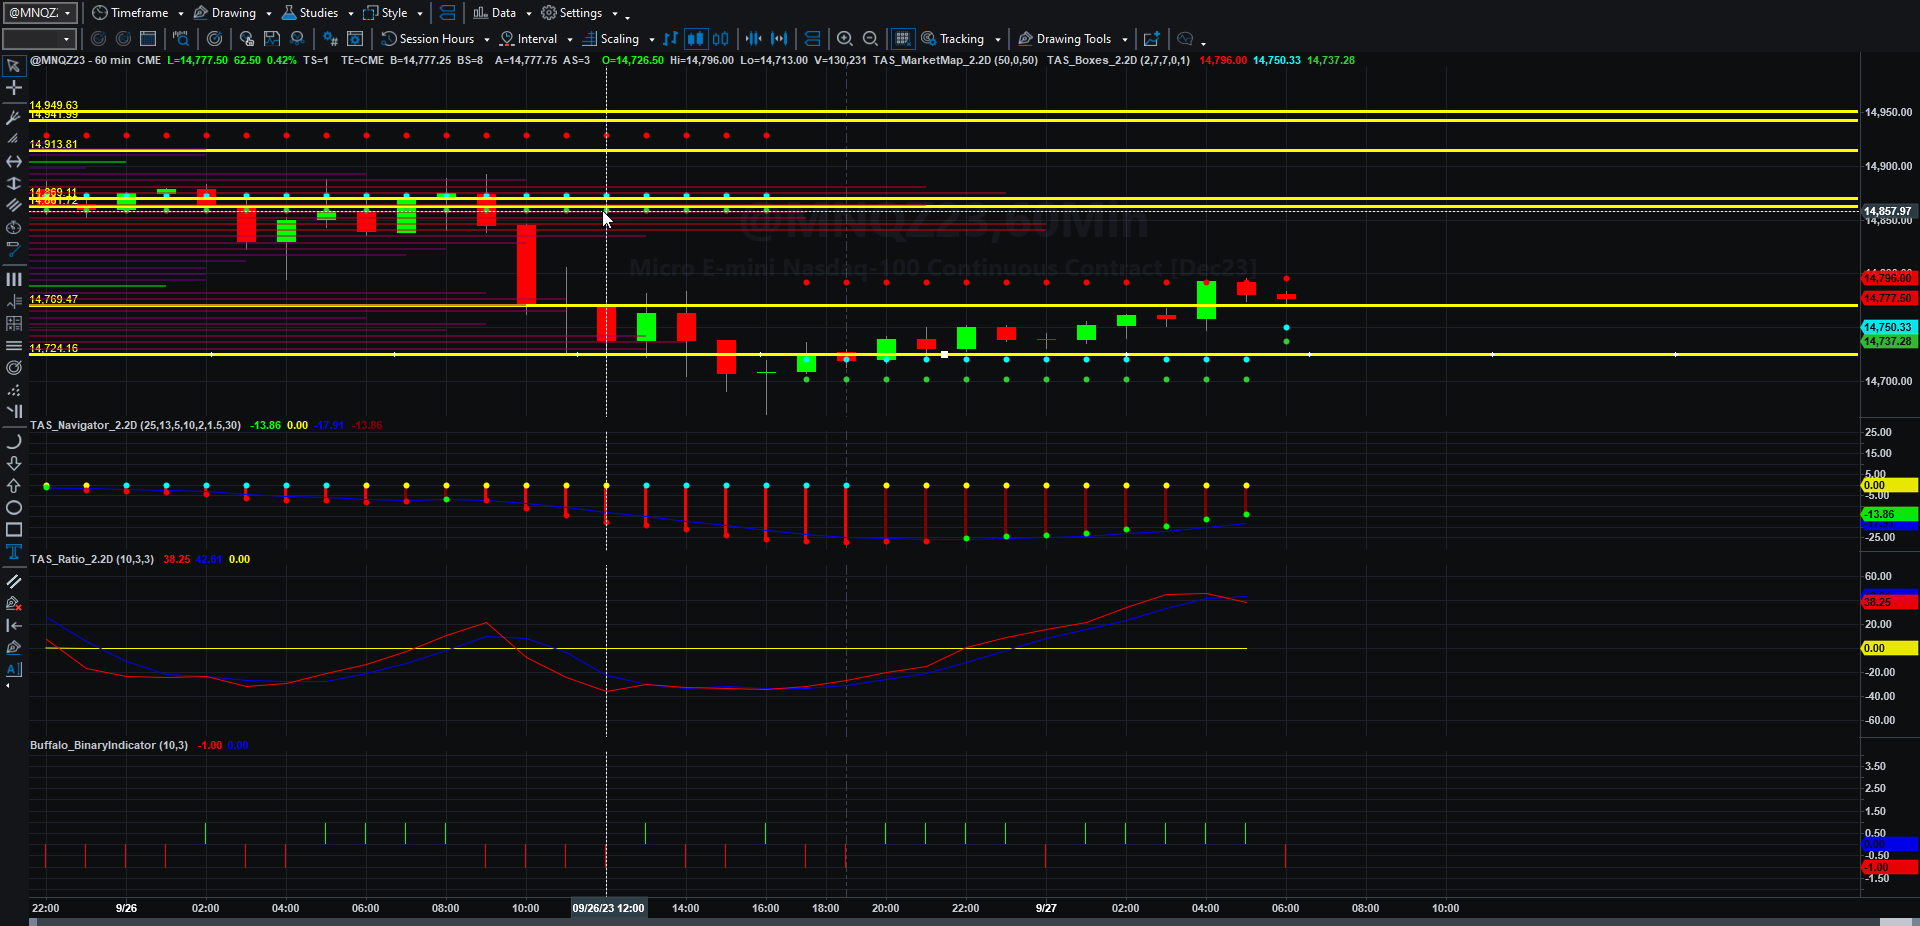
Price, Price Spread, Lagged Price/Volume Spread, and Binary Price/Volume Indicator
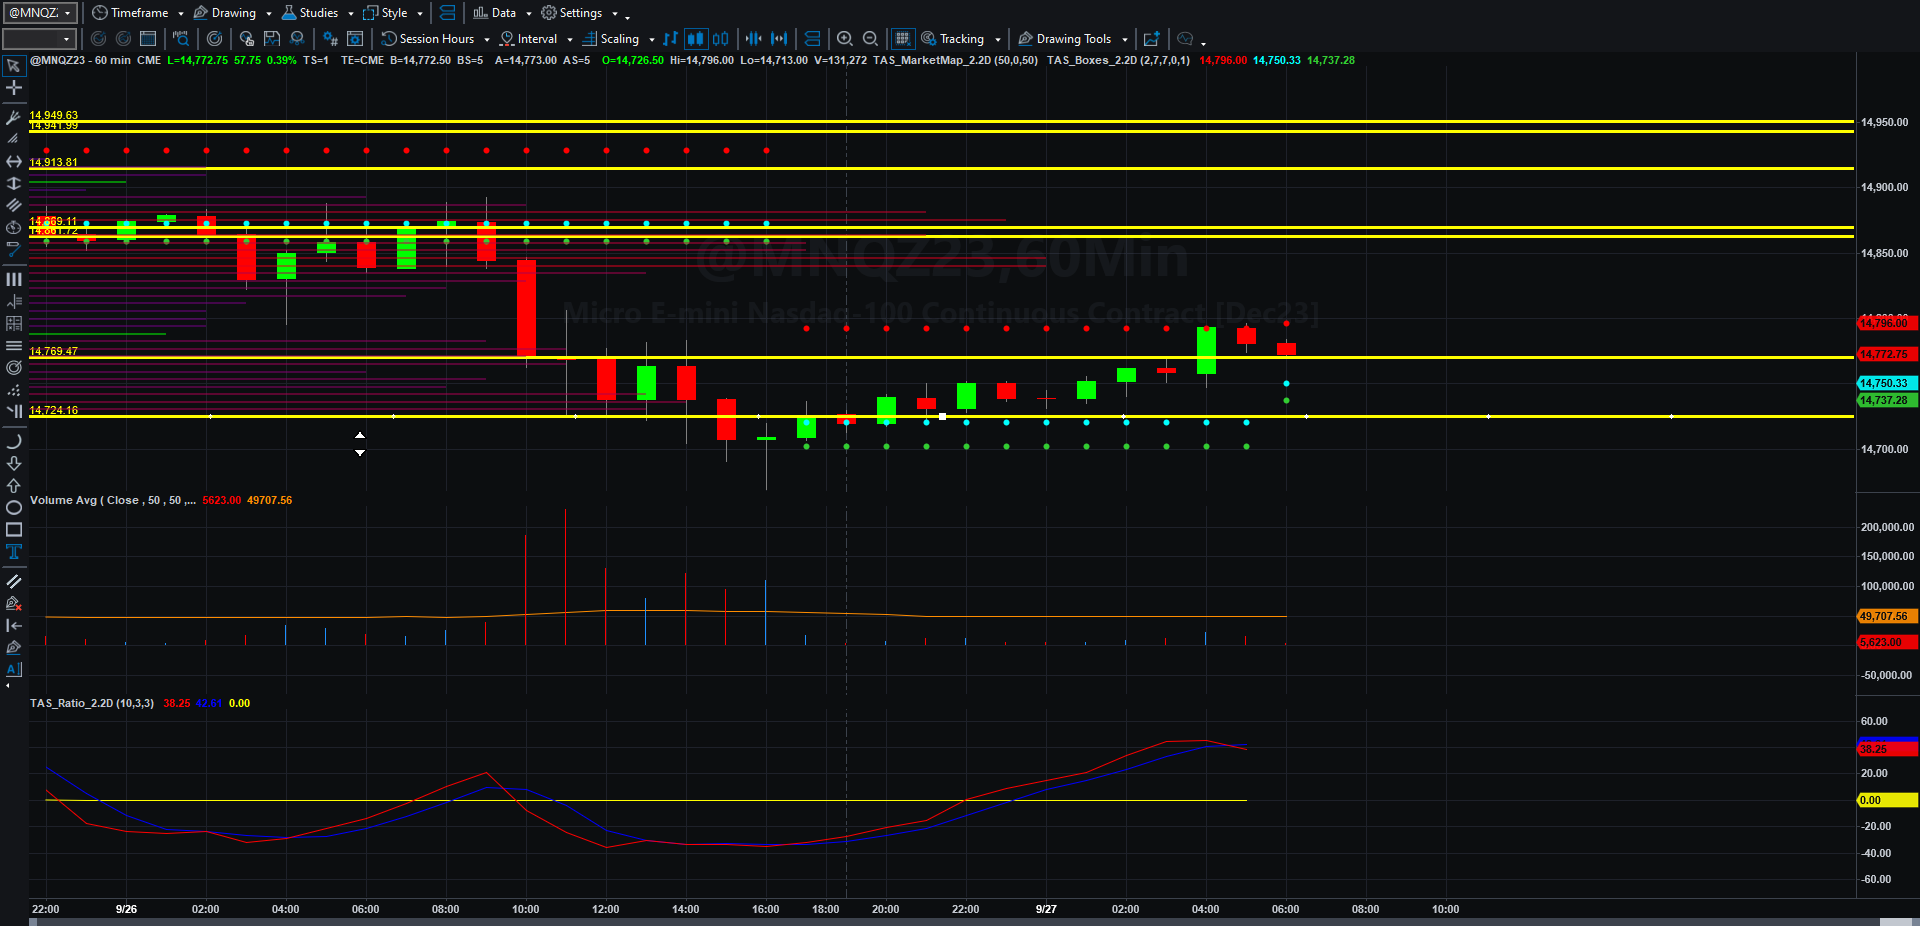
Price and Total Volume With 50-period Moving Volume Average
Fibonacci Price Scale With Targets
Yesterday was a nasty day on the NASDAQ (reminds me of an earlier time when I used to refer to every name on that list as a member of the “Nasty-dax”, as many companies on that list had little in terms of quality of earnings or business prospects). AMZN 0.00%↑ was hit with the expected anti-trust suit, and there were signs of economic downturn again. Lending standards also look rough for business generally.
Even Evergrande’s CEO was tossed into a PRC containment area, I would assume getting the Jack Ma treatment.
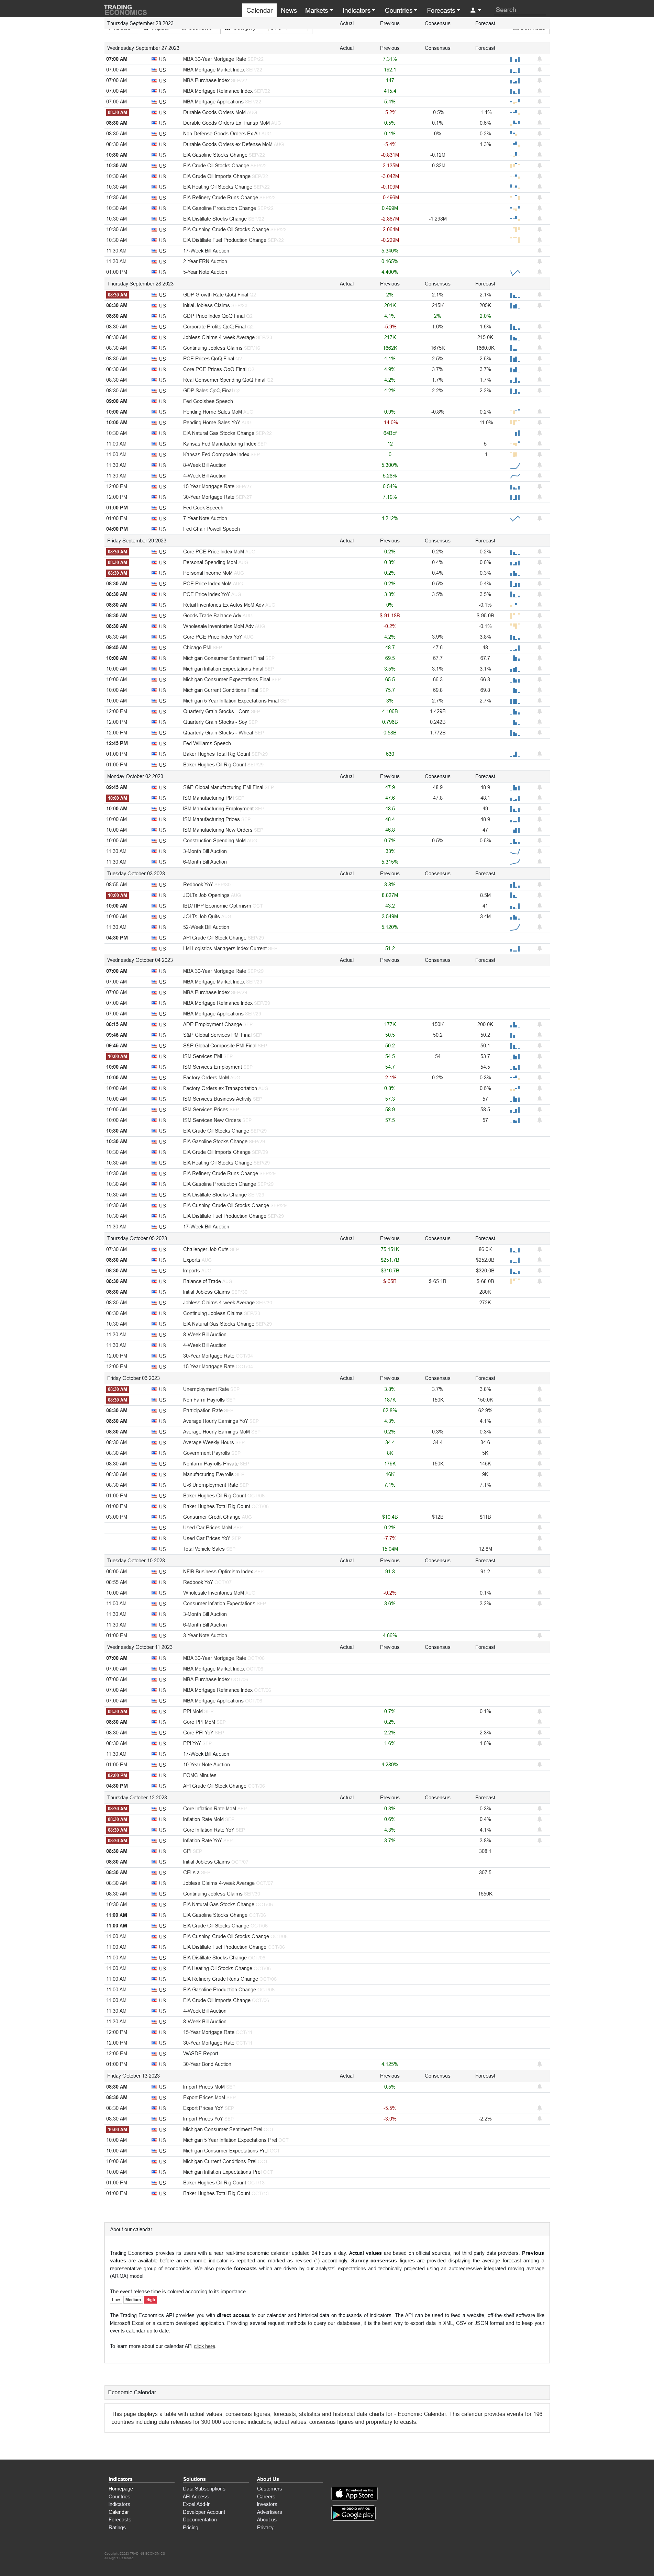
We will simply have to see how durable goods data goes today (and it expected to be negative). As quoted in this article about the general market:
“It’s fair to say that the mood is wary,” said Benjamin Picton, a senior macro strategist at Rabobank, in a note. “Let’s hope the data can continue to surprise on the upside. But for now, it seems the beatings will continue until morale improves.”
Things do look a bit rough.
Let’s go look at the charts.
Asia and Europe seemed to be buying MQNZ23 until the 0500 EDT hour and then it seemed European traders wanted to sell again.
If MNQZ23 can remain above 14769.50 it has a real shot at blowing out the very recent 14796 swing high to perhaps 14831.25 and even 14876 by Thursday as there are large caps in commercial holdings (and wide candlestick bars) above the current price levels. If it cannot rally above 14769.50, then it likely finds price support first around the 14724.25 VWAP line, and failing that, it could easily fall back to the swing low at 14666.25 and potentially rest at 14631 or even 14586 by Thursday.
It really will depend on the actions of traders after 0930 EDT. Even though I drew in an AB=CD pattern in hashed arrows, THERE IS NO GUARANTEE THAT SUCH A COMPLETION WILL HAPPEN. As I mentioned before, a change in sentiment now will push prices back toward 15000. The only real concern I have for long-only holders is that the floor below this could be as low as 14239. Anything can happen.
I picked up 21 NQ points per contract short yesterday. I will see what happens this morning to see if any other trades meet the criteria of my trade plan.
This is my 301st post on this Substack blog. I was shocked that it could last this long, but it has, thanks to the growing list of readers. At some point, if I know what readers want, I could expand this perhaps to a subscription like service to cover the additional costs of data, and I could expand market coverage further. It can never be what the old The Buffalo Trader blog was, in which I covered every stock, ETF, and mutual fund, and actually calculated and scanned neural-net-based patterns for setups each day, but this could be better than it is. Let’s see how other business interests run and I will consider such a thing.
It is important to understand how much I appreciate your support and readership. Have a fantastic Wednesday!
Today’s Economic Data Courtesy of Trading Economics dot com. Be sure to refresh the date at the top left.