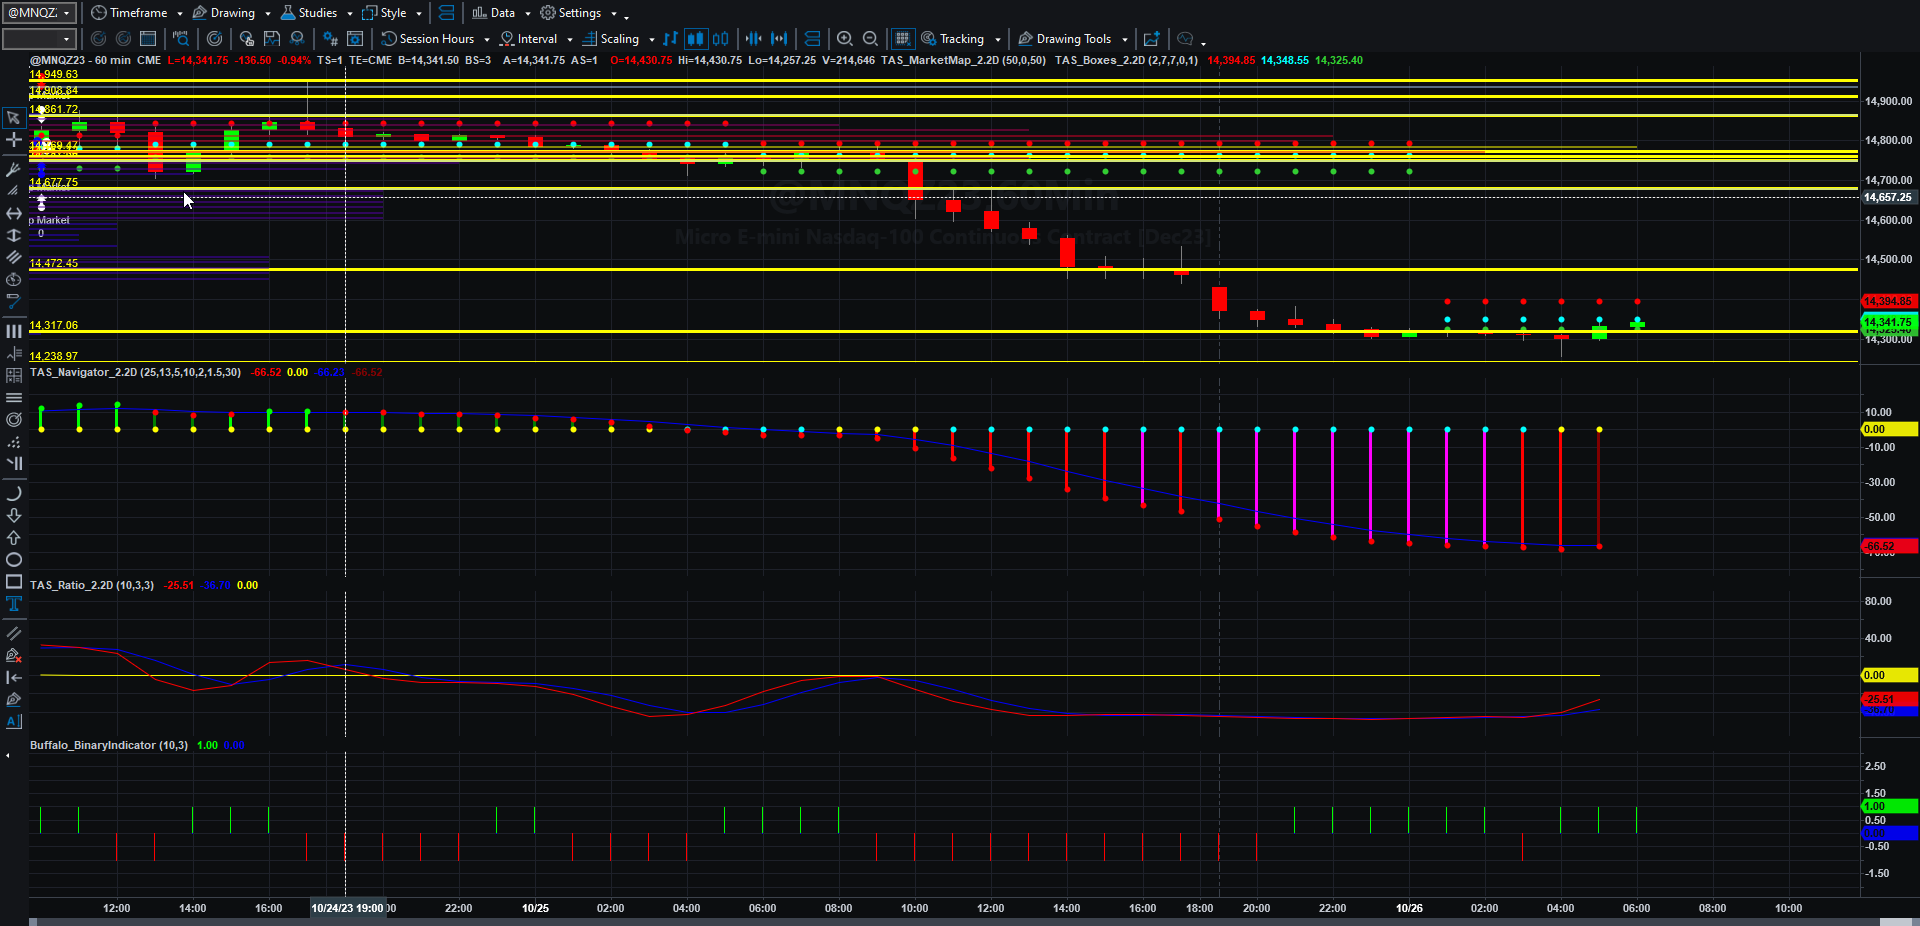
Price, Price Spread, Lagged Price/Volume Spread, and Binary Price/Volume Indicator
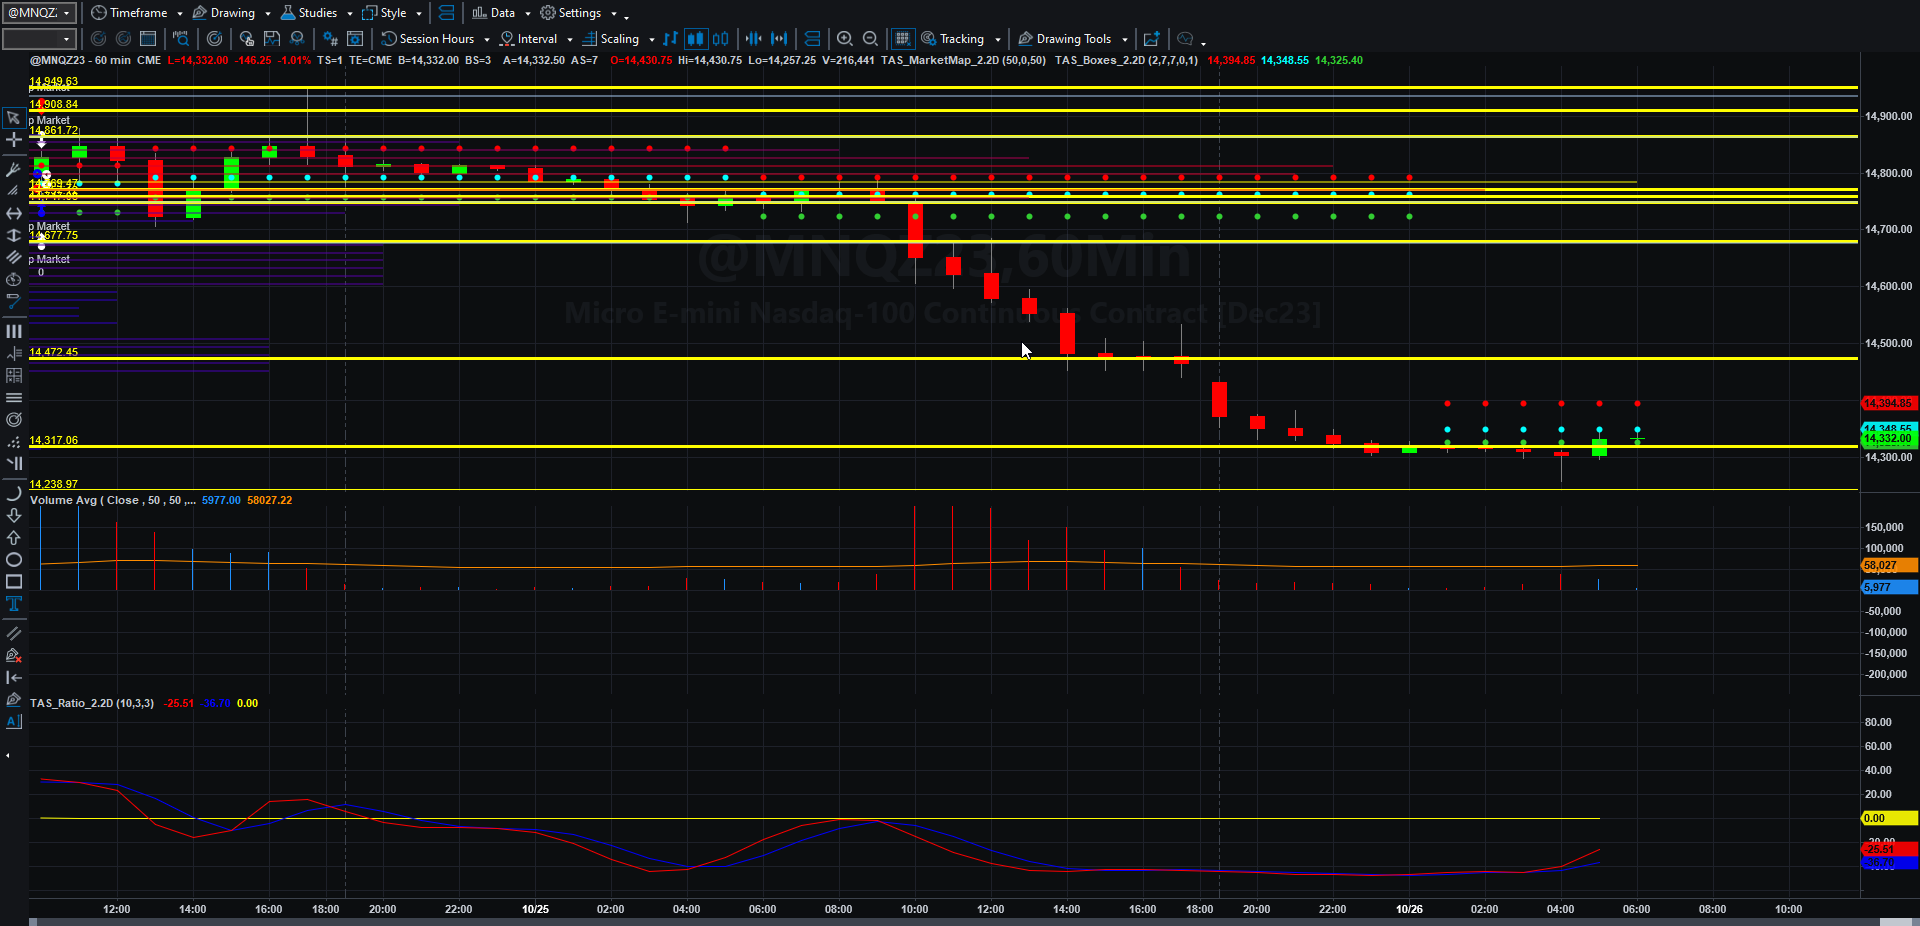
Price and Total Volume With 50-period Moving Volume Average
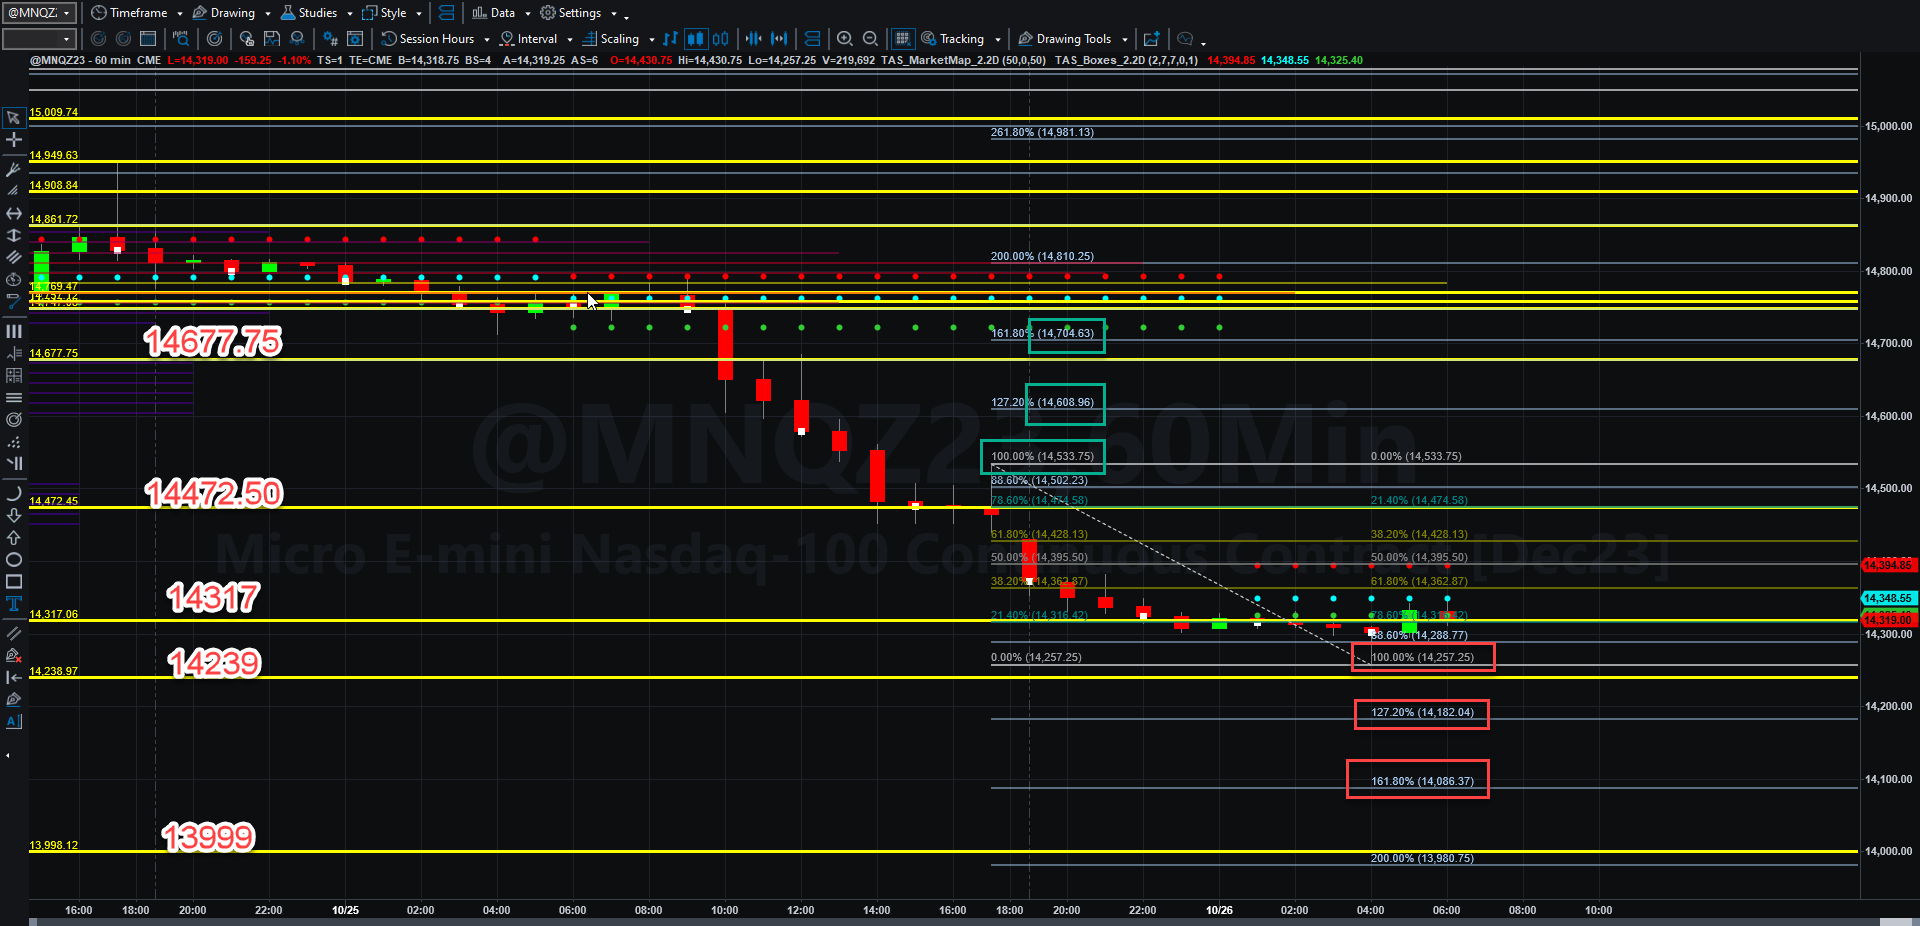
Fibonacci Price Scale With Targets
Remember this chart from October 14?
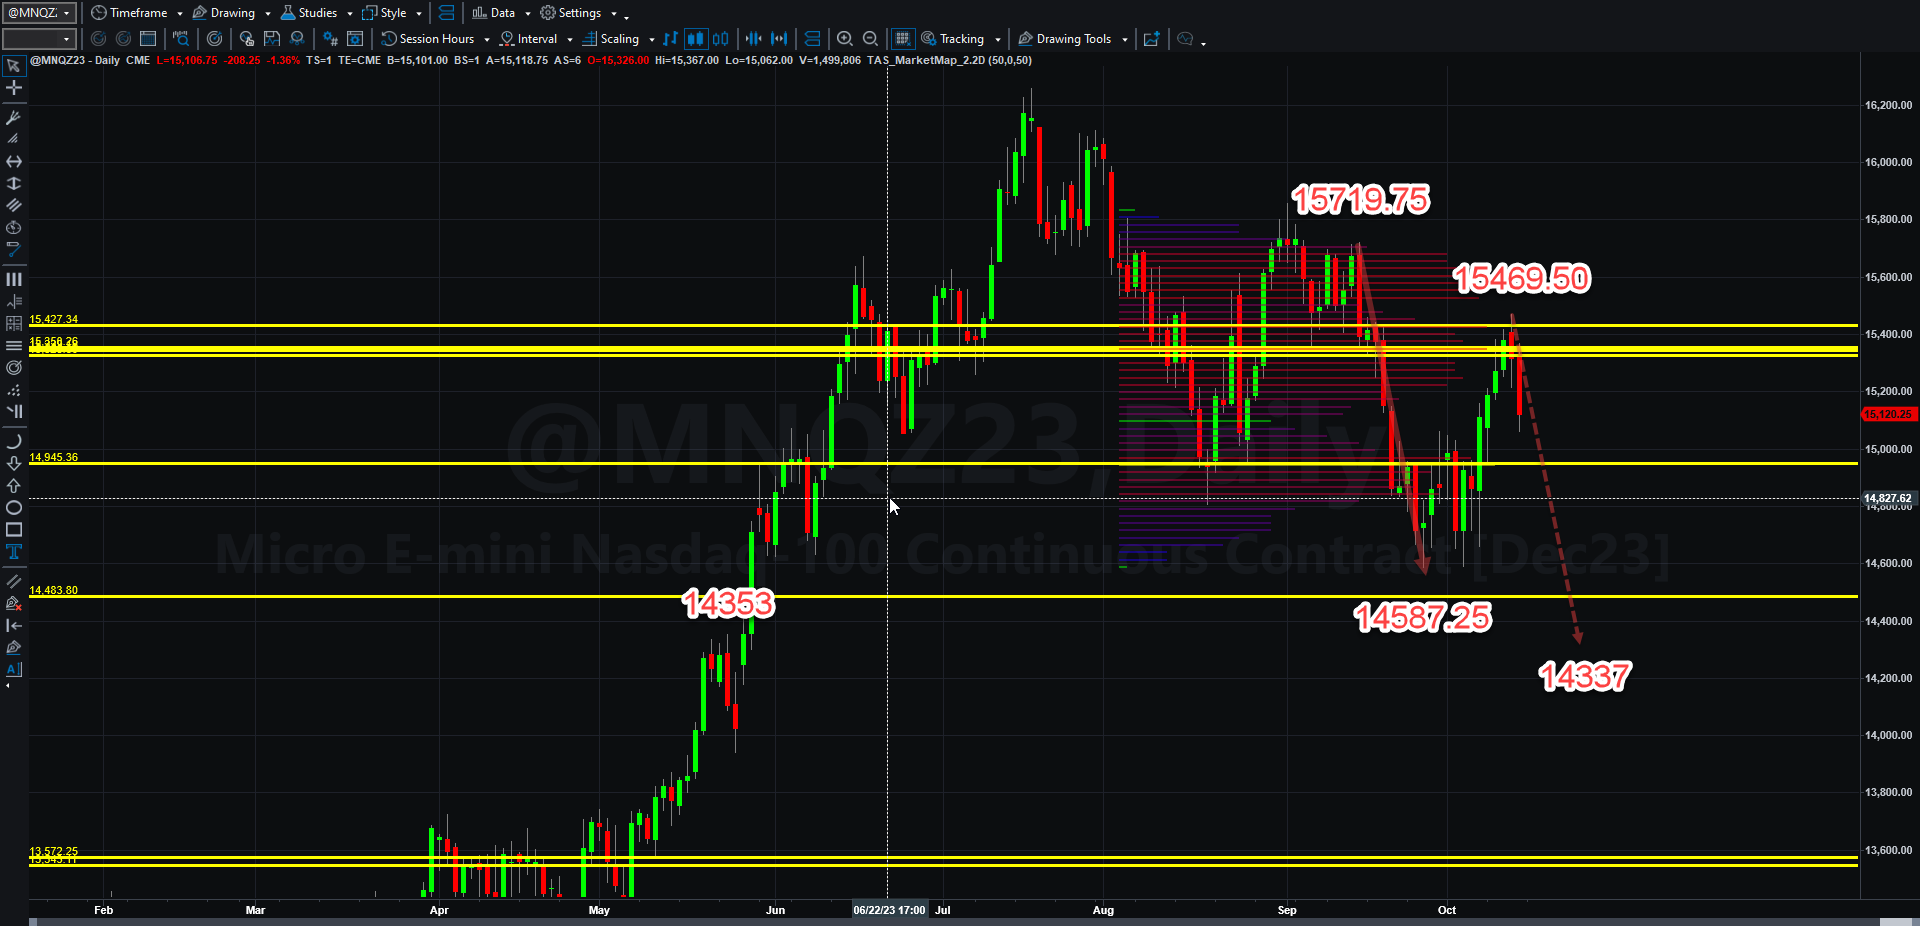
That pattern basically completed last night in Asia and Europe as sellers, I would assume, continued to worry about earnings prospects for tech stocks (and stocks generally). I am not patting myself on the back (in fact I was a bit disappointed that I could not trade last week). What I want to demonstrate to you is that three-drives-to-a-bottom patterns happen often in panicked bull or bear markets, as they lead to rapid price movement. They can be useful guides for price projection (and their one hell of a lot easier than Elliot Wave counts, as they are in fact measurable).
Earnings worries continue to persist on the advent of GDP growth data this morning and growth data is forecast to be strong (4.2%) in Q3 2023. We will simply have to see how the data makes markets react, as we have inflation data tomorrow to deal with.
Xi Jinping continues to seek villians he can blame for economic shortfalls in the PRC. With military purges and reviews of the banking system, Chairman Xi seeks to consolidate power to prevent a challenge to his own leadership, all while world tensions increase in the Middle East.
I could continue, but instead let’s address the charts.
What we have seen is a peeling back of the Federal Reserve-fueled “covidiocy” rallies happening in real time as investors seek relative safety of bond yields or perhaps cheaper equities in other sectors. Whether this continues will be determined by market participants’ reactions to earnings and economic data.
MNQZ23 seems to have settled out in Europe near its swing lows of this session. If MNQZ23 can rally above the 14317 VWAP line, it has a decent chance of rallying back to the 14472 VWAP line and beyond, perhaps to the swing high of 14533.75, and beyond perhaps to 14609. If buyers become aggressive, it could even rally beyond the 14677.75 VWAP line to 14704.50 by Friday.
If not, it will not take very long for sellers to push beyond the 14257.25 low and the 14239 VWAP line to hit 14182 and 14086.50 by Friday if selling persists.
No one can be certain what will happen, but once again, the gaps beyond current trading prices and commercial holdings in both directions is wide. We could be trading in the 15-handles or even back to the 13-handles next week. It all depends on who shows up to trade. That is how nuts the current market conditions are.
I picked up 18 NQ points per contract yesterday and I shifted gears into other business. Volume was a bit steadier than it was on Tuesday.
That is it for me today. I hope your Thursday is happy and successful!
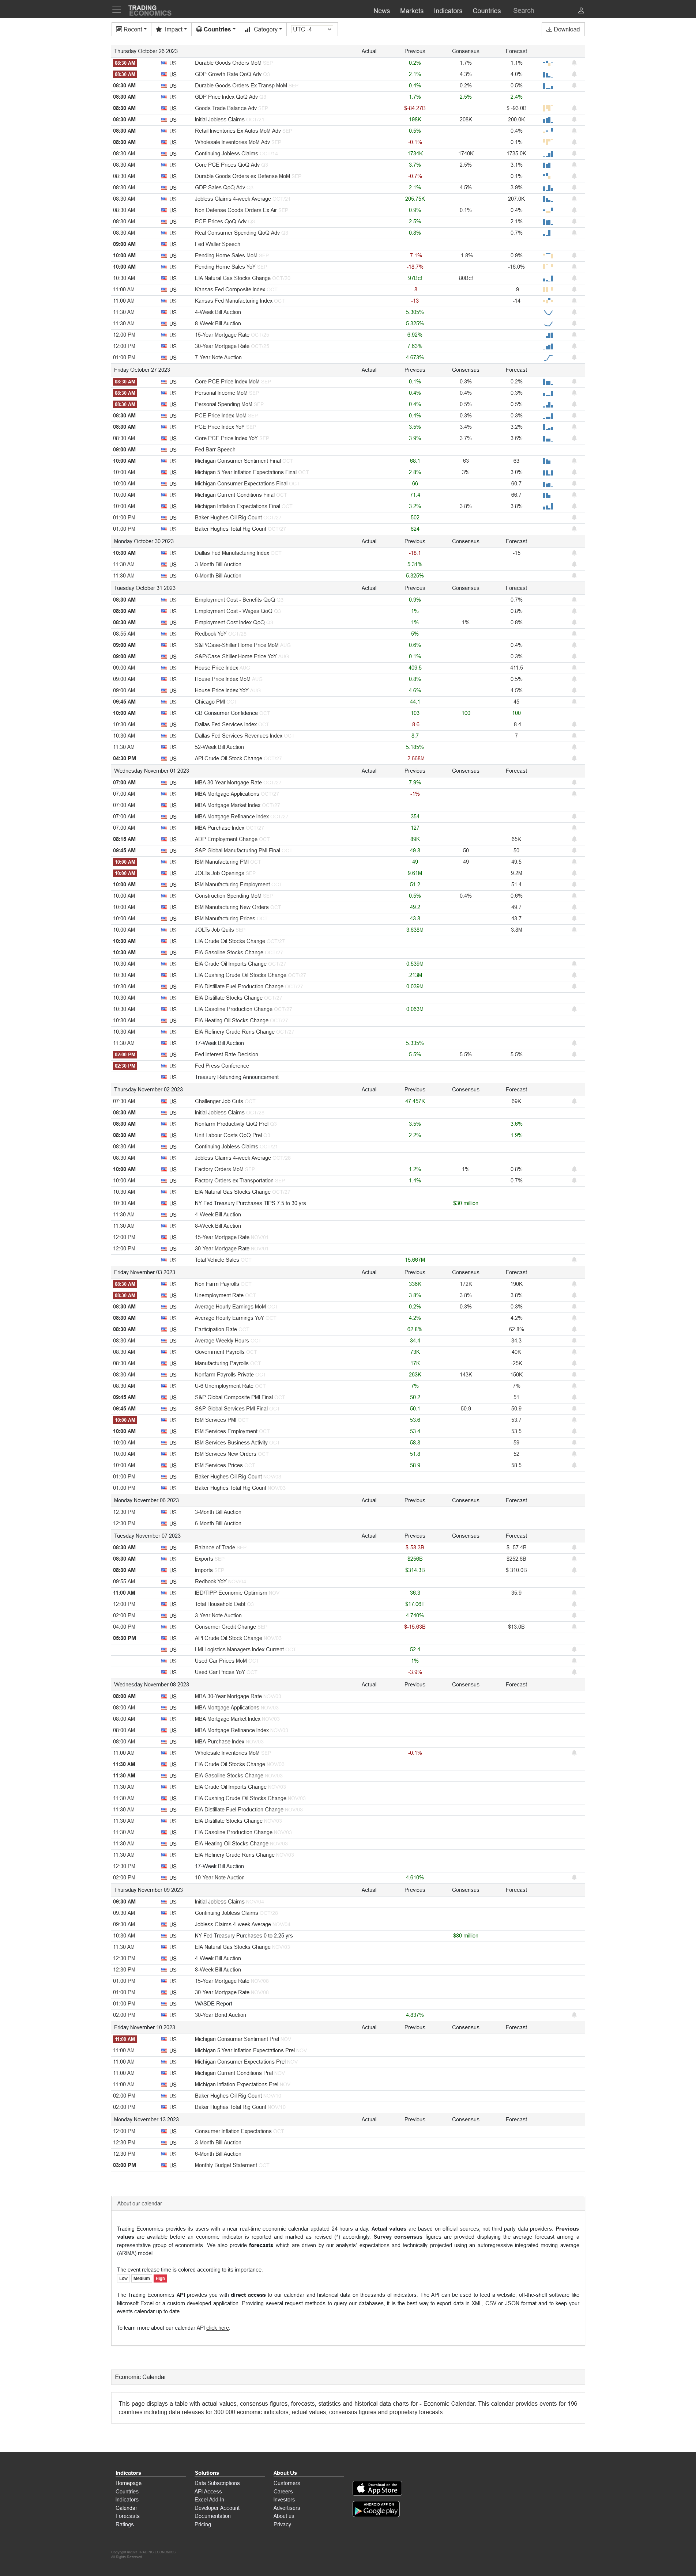
Today’s Economic Data Courtesy of Trading Economics dot com. Be sure to refresh the date at the top left.