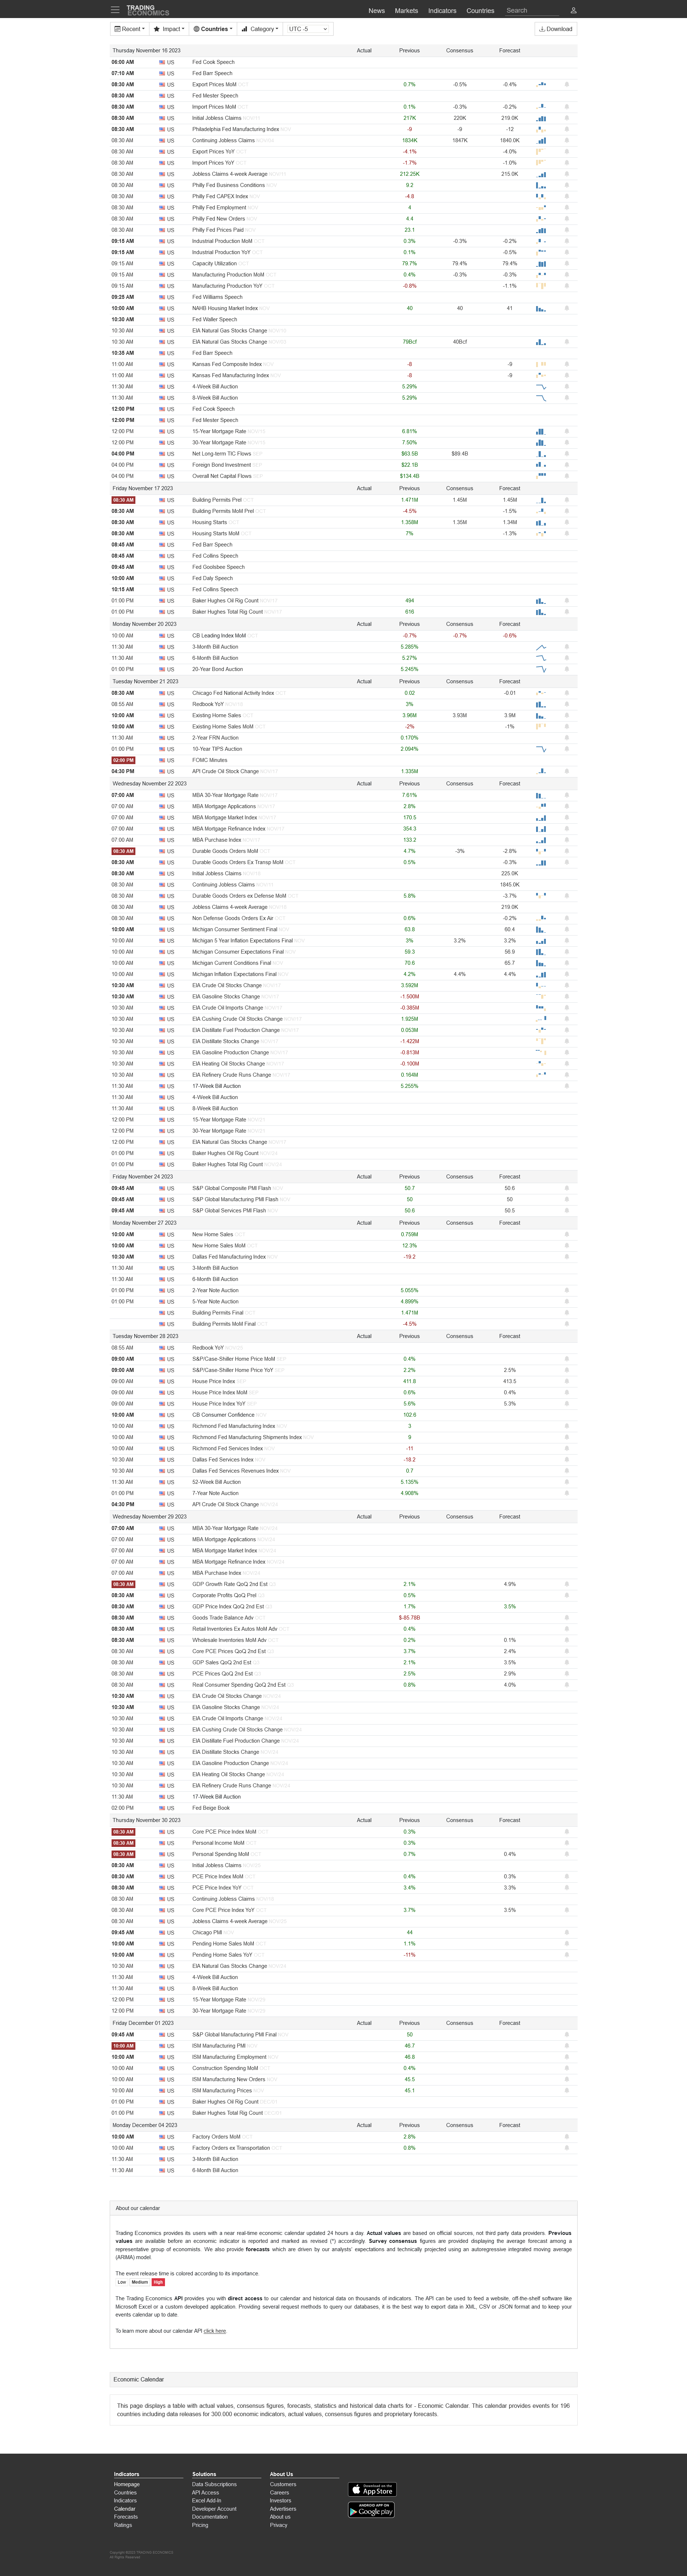
Price, Price Spread, Lagged Price/Volume Spread, and Binary Price/Volume Indicator
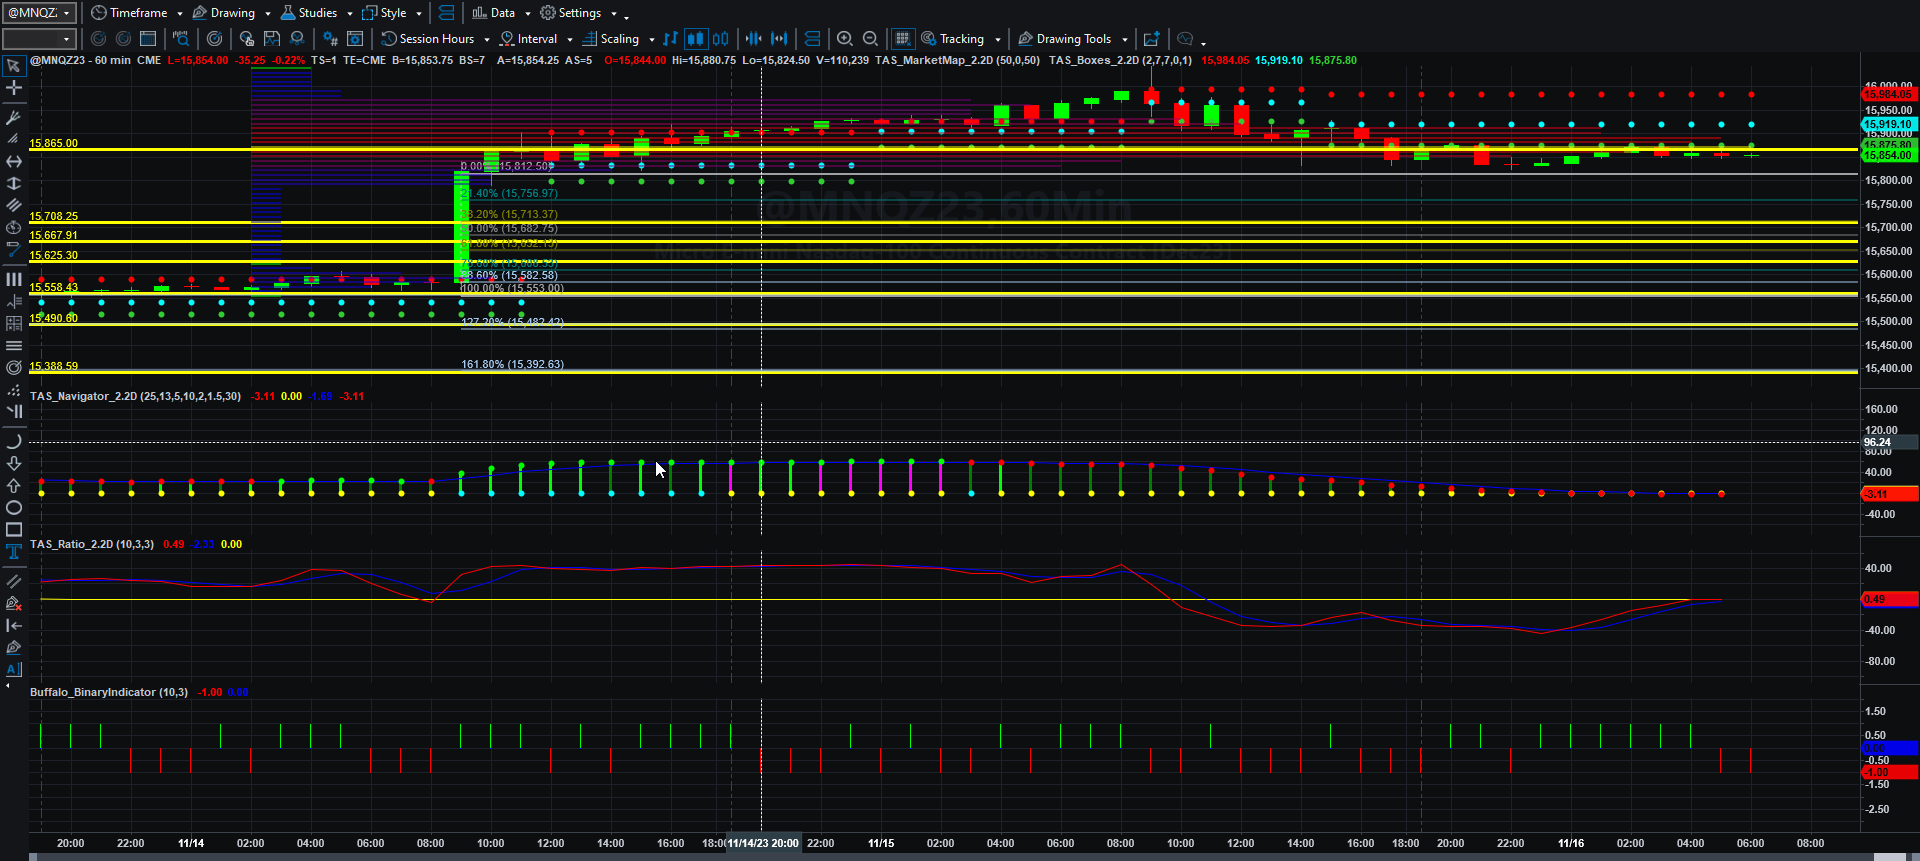
Price and Total Volume With 50-period Moving Volume Average
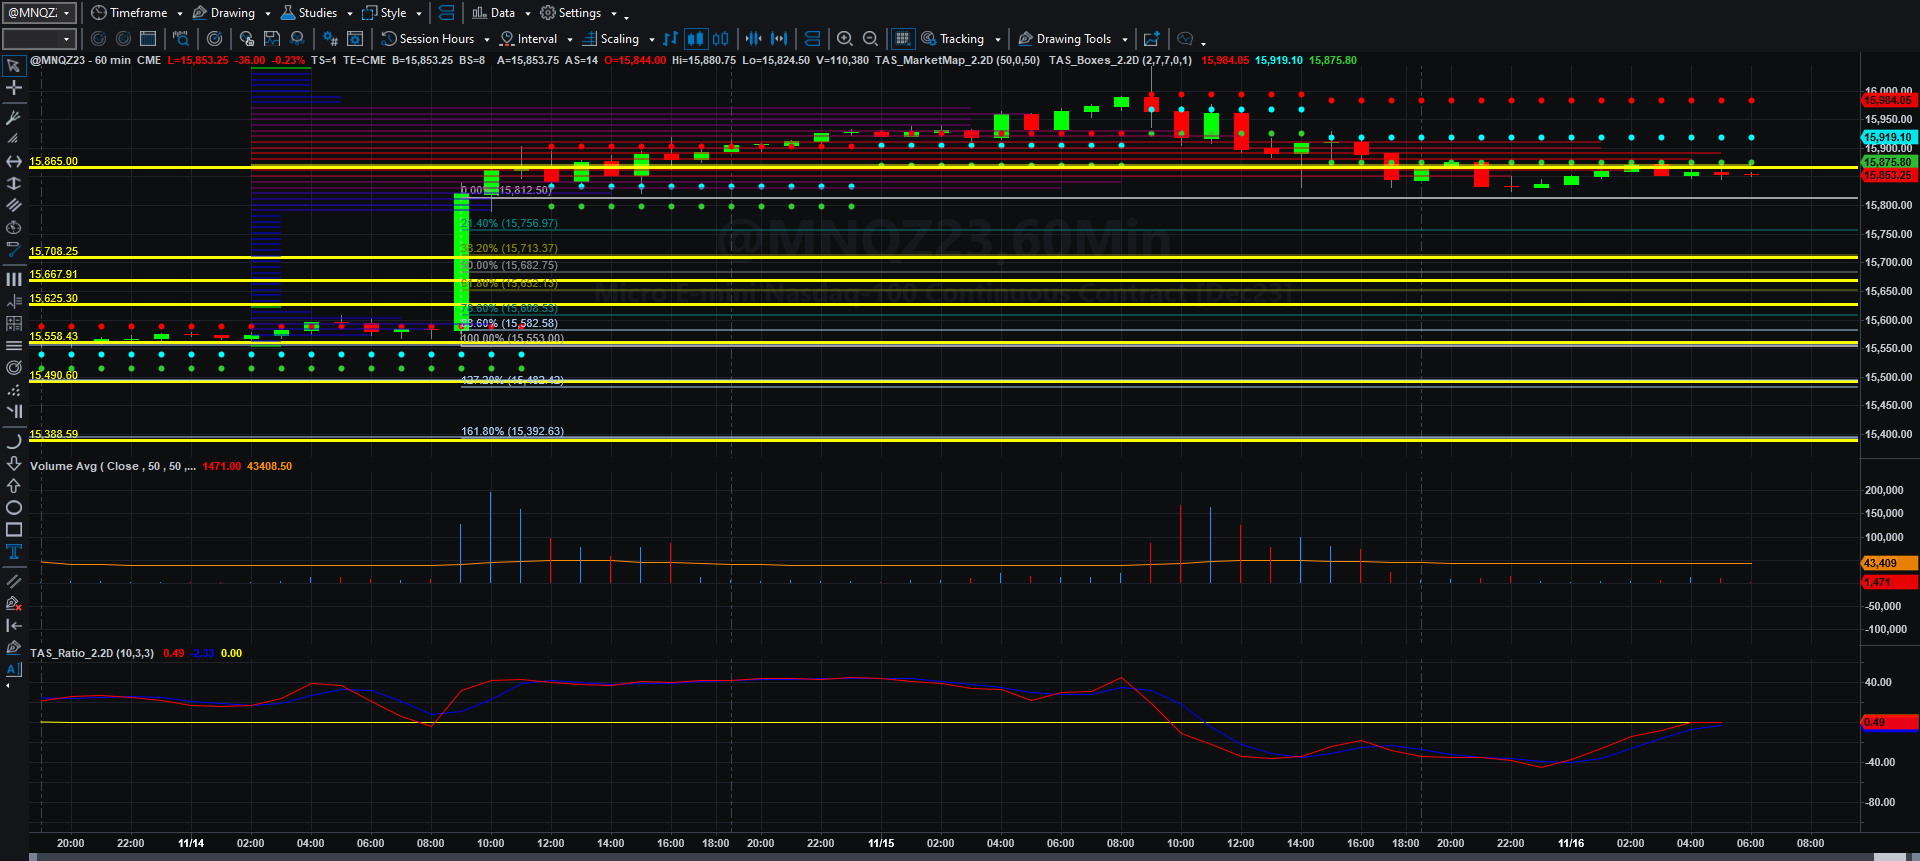
Fibonacci Price Scale With Targets
Thursdays it seems I have less time to write because of early morning commitments, but I will leave a few links and notes of interest.
Even though Joe Biden called his Chinese counterpart, Xi Zinping, a dictator, these two have apparently resolved to communicate at the senior military levels and to cut fentanyl exports. That is something I would have thought Xi could be arrested for, since it has killed tens of thousands of Americans. I am still uncertain as to how the negotiations help American corporations with manufacturing operations in the PRC, but only time will tell.
MNQZ23 cooled a bit from Wednesday’s close perhaps because euphoria ended over the last reported CPI data. There are indeed questions about the veracity of the data, posted in a summary video here. I do not endorse or subscribe to the newsletter. I just like the analysis being presented. The proportion of costs in the budget are indeed skewed and the CPI data purports that insurance costs have dropped 34% which is preposterous, particularly if you have your own policy and have any kind of long-term insurance. Mine alone could climb about 24% next year after two successive 16% increases the previous two years. The video is worth a watch.
There are so many factors in world political conflict that could change everything, particularly on the energy front. Are rates really going to be cut dramatically? If you look at the Middle East, Turkey is ready to get involved in the Israel-Gaza crisis and if there is no ceasefire, one could imagine Iran closing the Strait of Hormuz, and Egypt shutting down the Suez Canal, and all of a sudden the world is embroiled in an energy crisis with our strategic petroleum reserve on fumes. We are a long way from true inflation taming methinks.
There is also a ton of skewed data on housing, as Mohamed E. El-Arian released. Much of what is shown in the chart is true, but in the case of mortgage costs, most homeowners have fixed mortgages, which insulate them from the rate increases shown in this chart. What it DOES do is limit the amount of existing home inventory for sale and that is frustrating for new home buyers who cannot save enough to pay for a larger down-payment.
Congress also refuses to cut spending, and that combined with uncapped Federal spending through at least January 2025, inflation will continue as it is a monetary phenomenon of too many dollars chasing too few goods. I still think it is way too soon to call a truce on inflation.
Let’s go to the charts.
If MNQZ23 can rally above 15865, if could easily rally to the swing high of 16049 and press on to 16110 and beyond to 16187.75 by Friday if buyers become as active as they were on Tuesday. If not, it is possible that the long green candlestick created by the CPI print will be gobbled up as sellers press beyond the swing low at 15824 perhaps falling back to 15763.50 and even 15685.75 by Friday, if events provide sellers with an opportunity to pile on to negative market action. Anything can happen which is why I look for price momentum, patterns, and volume profile to make trading decisions.
I picked up 20 NQ points profit per contract being short yesterday and once completed I moved on to other action as volume somewhat dried up as the morning moved on.
I hope everyone has a pleasant Thursday, and that you put money in the bank today! Thanks again for supporting this Substack. If you have questions, leave them in the comments.
Today’s Economic Data Courtesy of Trading Economics dot com. Be sure to refresh the date at the top left.