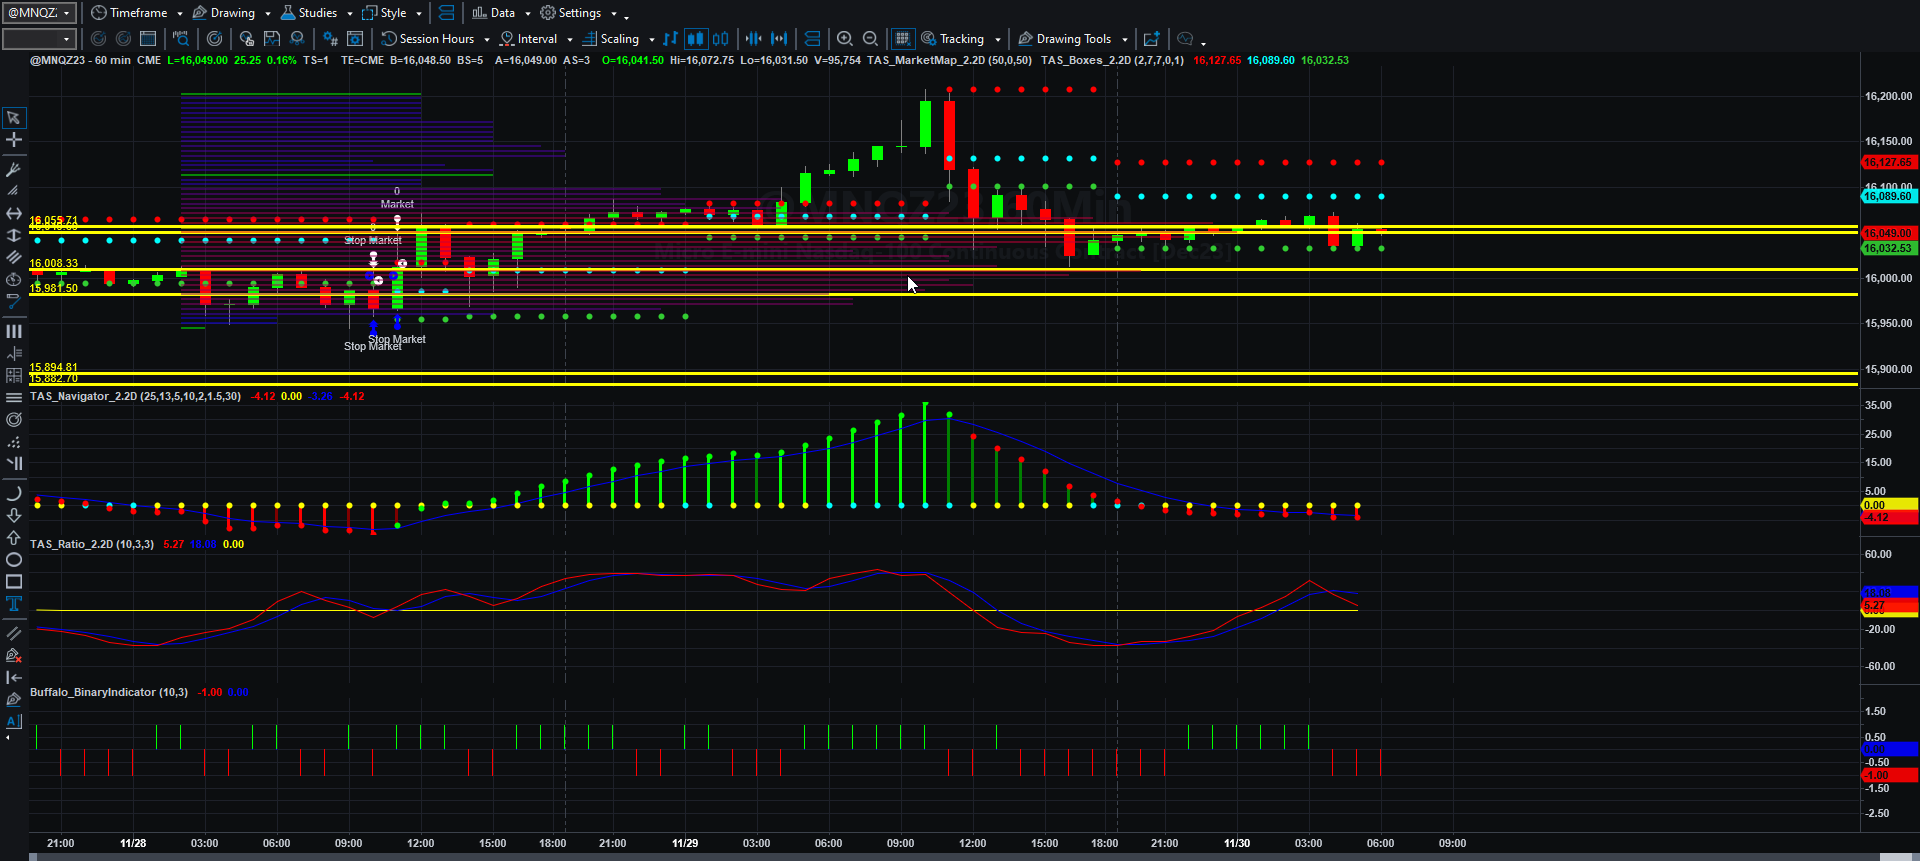
Price, Price Spread, Lagged Price/Volume Spread, and Binary Price/Volume Indicator
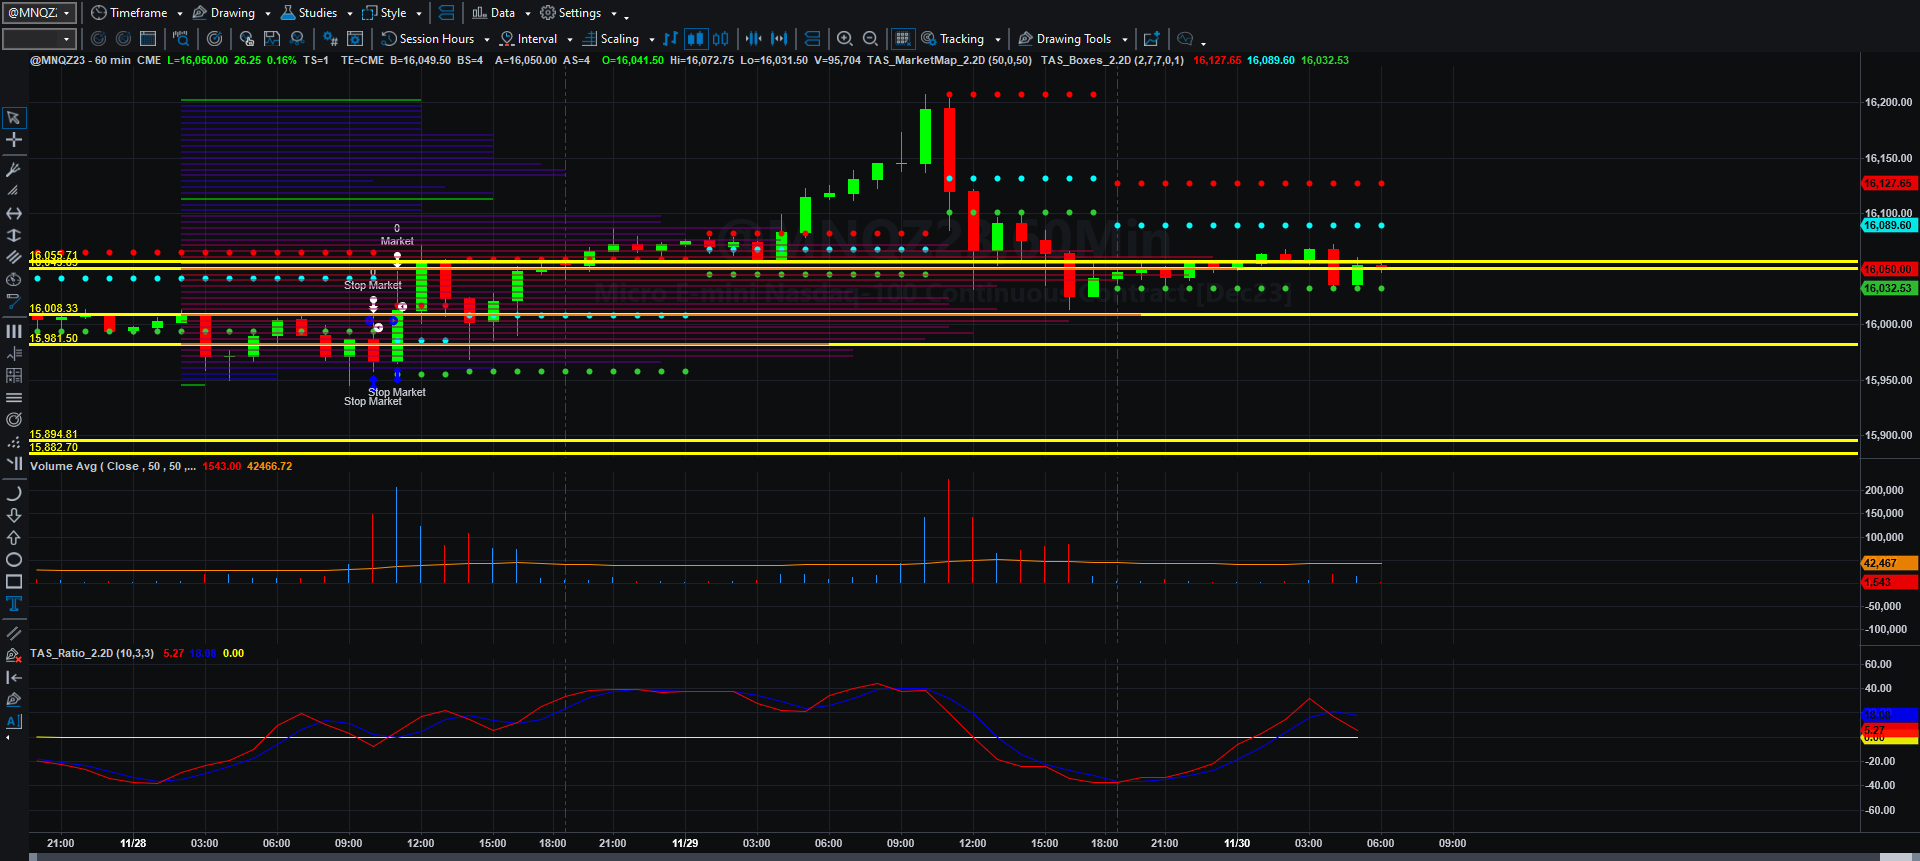
Price and Total Volume With 50-period Moving Volume Average
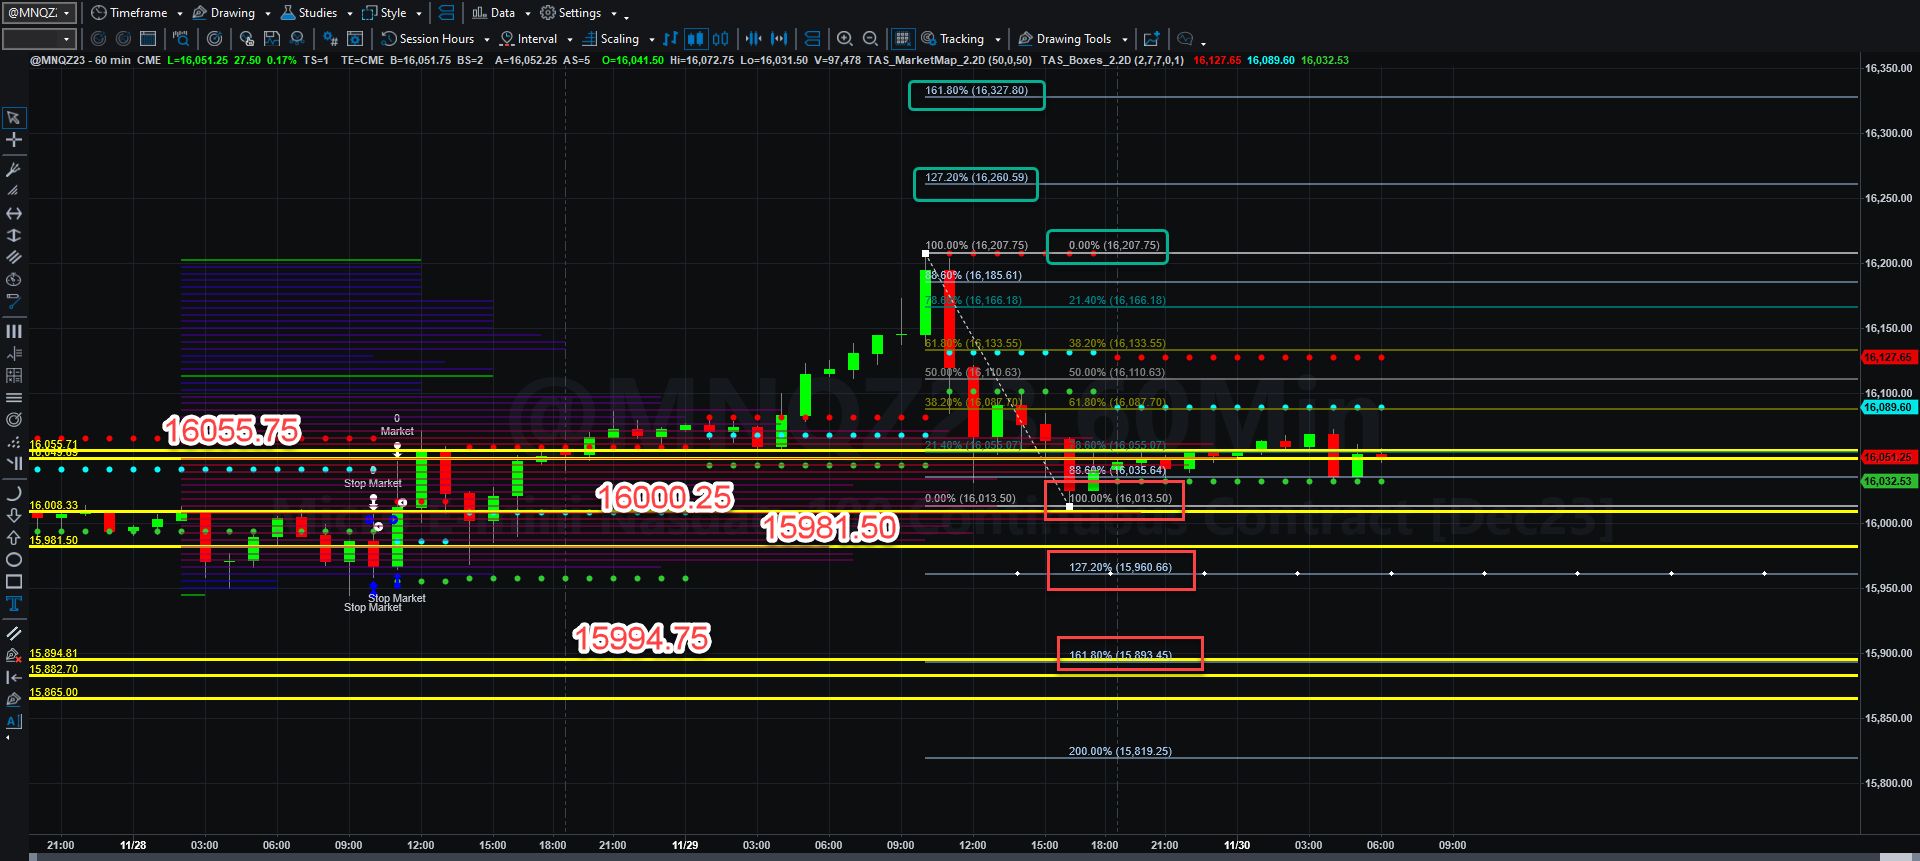
Fibonacci Price Scale With Targets
A lot’s happening in the news today. Henry Kissinger passed and an icon, for good or ill, of the entire era of Cold War politics no longer has influence. The Gaza-Israel conflict gets one more day of reprieve as the Saudis, absent any focused American response, attempt to assuage Iran and its surrogates to end the fighting. The Iranians are indeed keeping watch on American naval assets off the coast of Israel.
Despite the calls by many analysts that the U.S. economy is heading for a soft landing, the evidence for recession continues to build. When one looks at a divergence in GDP and gross domestic income (GDI), credit availability, mortgage demand, and other factors (like temporary work), one sees signs of a recession at hand. What is also somewhat troubling is the idea that inflation is cooling, when the printing presses at the Treasury are wide open with no cap on spending in Congress. In the course of three months time (including December), the U.S. National Debt will have increased to roughly $34 trillion with no end to the pile-up in sight. Since inflation is a monetary issue, one must stop printing worthless currency and set spending priorities to stop it. We’ve not seen any action by our political elites to do that. It is possible that the “slowdown” is a bit cyclical like it was in the 1970s.
What is even more interesting is the U.S. government’s censorship of inflation data. That is incredibly hard to censor unless you live in a police state. We even have an example of that in the PRC. It seems the twin realms of crony capitalism and fascism seem intent on telling you that “everything is fine” even when it is not exactly. We will still get a pretty good indication of economic activity with PCE, personal spending, and personal income data. If you do the math, even on the estimates, in aggregate Americans are spending more than they are saving and that is a bearish indication of future activity, as savings eventually run dry.
Oh, and you better save your Gmail account if you have been inactive. Google will erase it on Friday.
We can discuss the economic data again later. Let’s get back to the charts.
If MNQZ23 can rally above 16055.75, it has a chance to fairly quickly run back to 16207.75 and even 16260.50 and beyond that to 16327.75 by Friday, depending upon how aggressive buyers are. If this doesn’t happen, then the swing low at 16013.50 will likely be taken out, and lows of 15960.50 and 15893.50 are possible by Friday. If the PCE data surprises the markets, these ranges are possible in either direction. We will simply have to watch volume, volume profile, and Fibonacci pattern and extension data to measure and trade the bipolarity of the current market environment.
Yesterday I took a net of 7 NQ points long per contract, as a bounce in volume caught the first trade for 12 NQ points, but the next trade long netted 19 NQ points. We will see what happens today. I have no idea what the outcome of the data announcement may be. I just use the charts and trade what I see.
That is all for me today. Make it a profitable, productive, and happy Thursday!
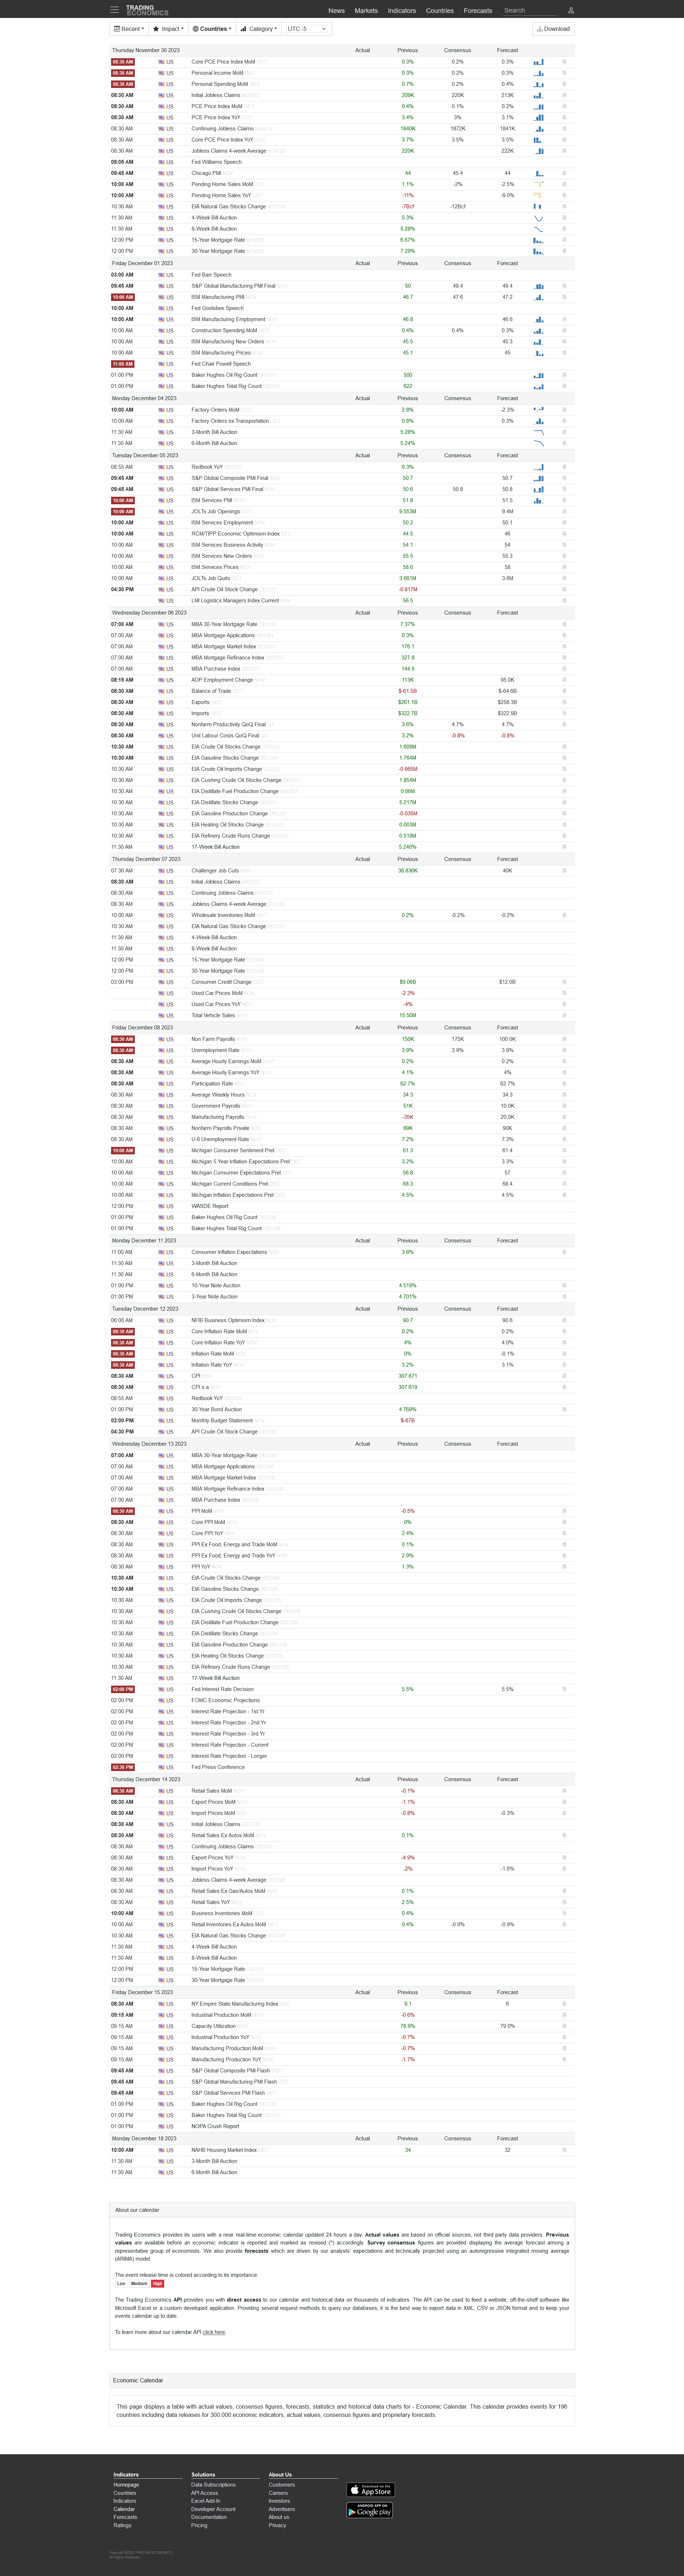
Today’s Economic Data Courtesy of Trading Economics dot com. Be sure to refresh the date at the top left.