

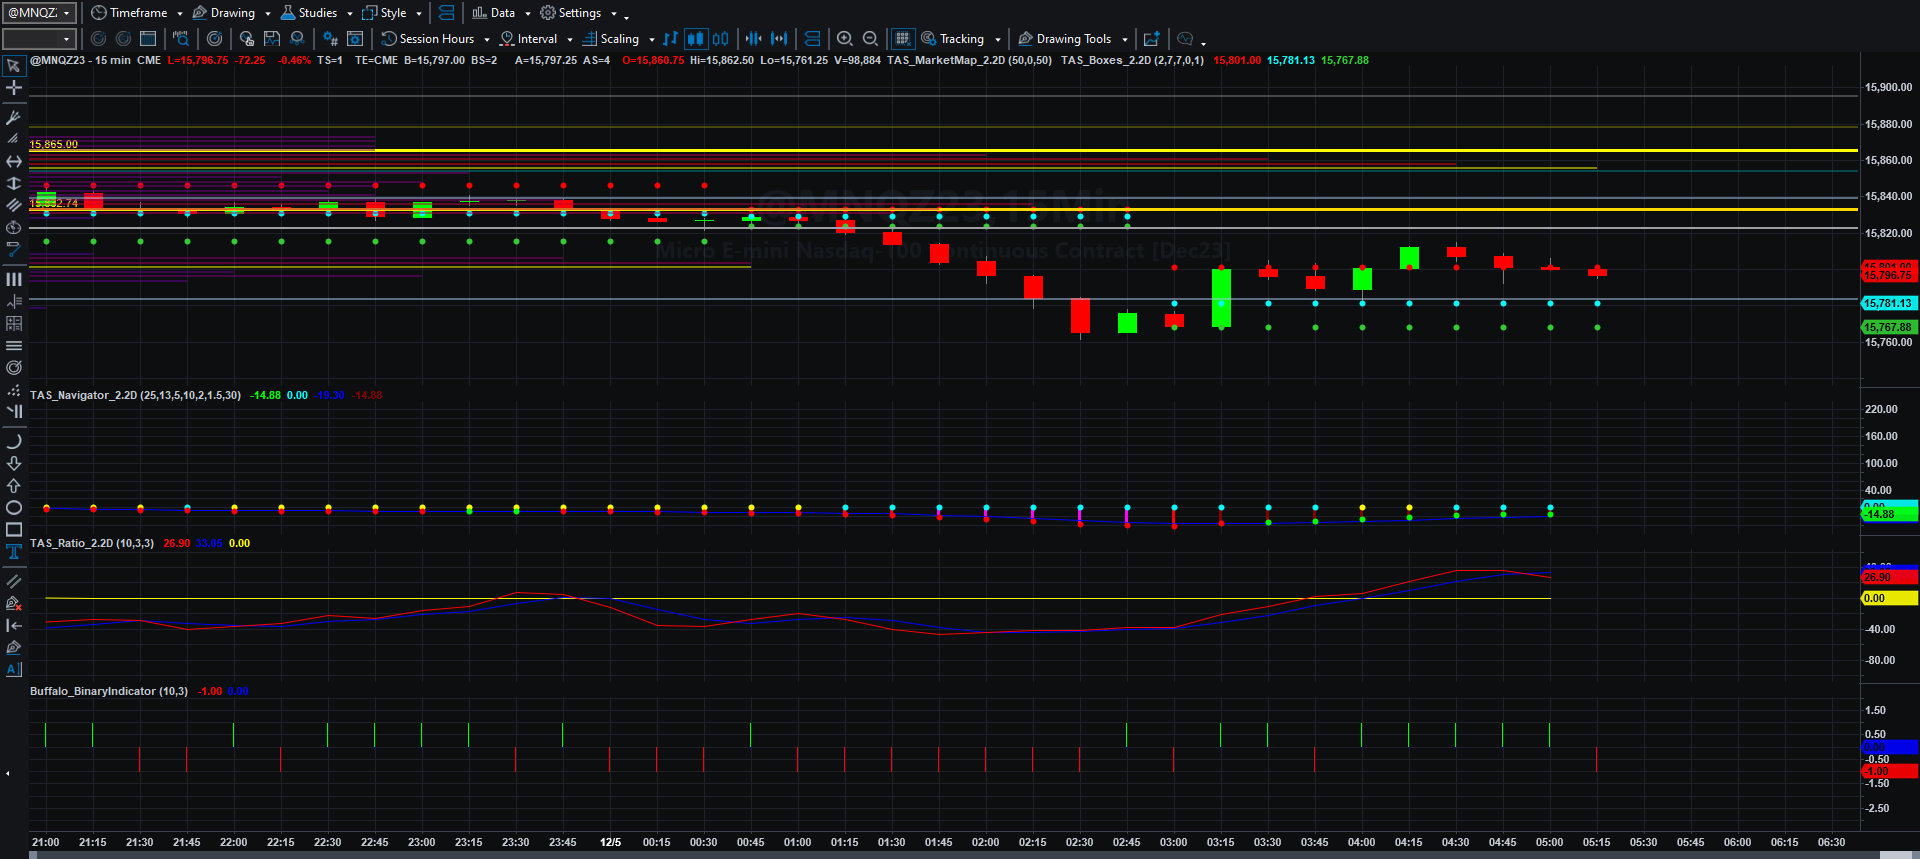
Price, Price Spread, Lagged Price/Volume Spread, and Binary Price/Volume Indicator
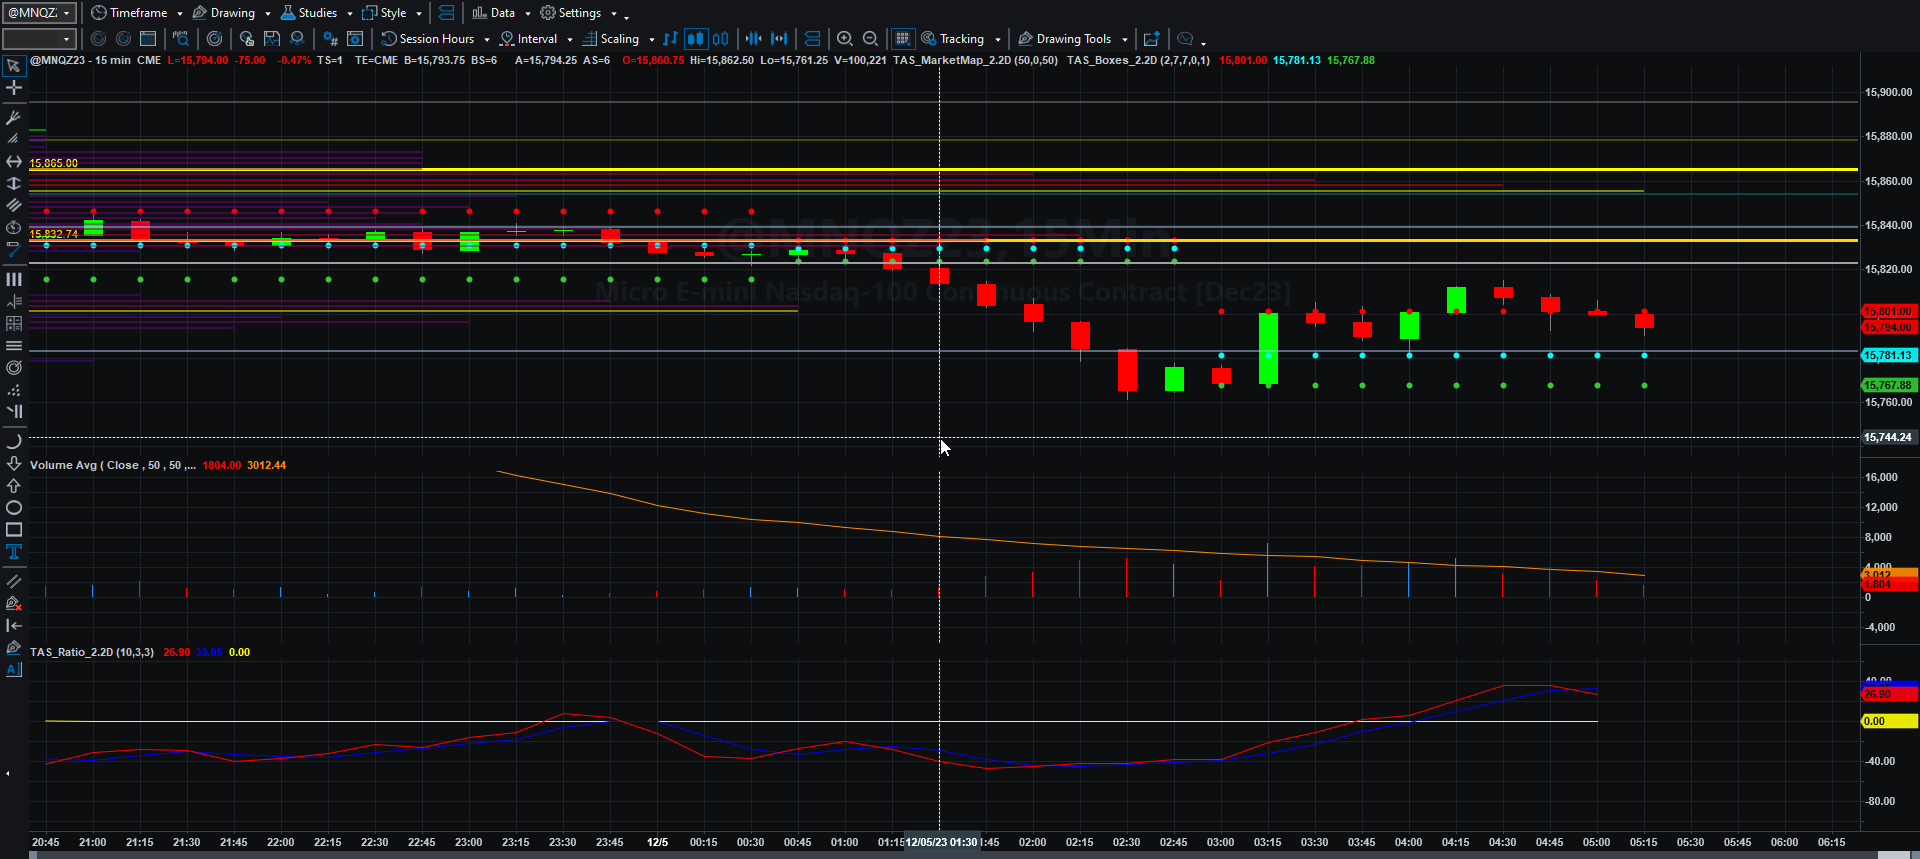
Price and Total Volume With 50-period Moving Volume Average
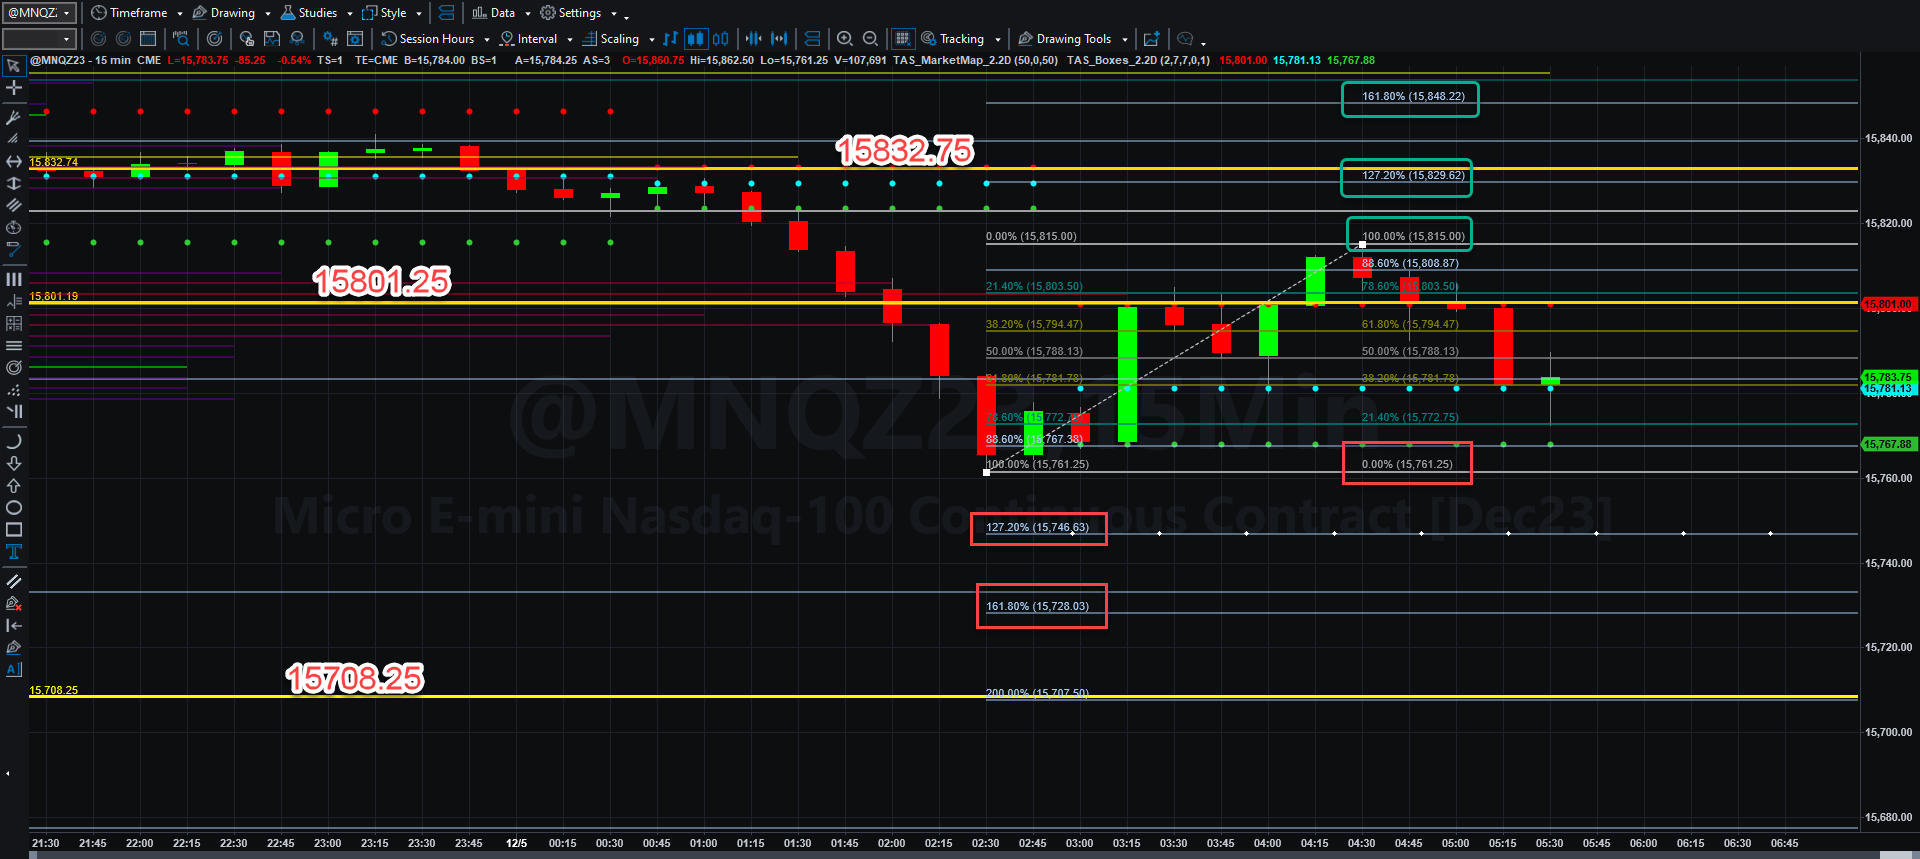
Fibonacci Price Scale With Targets
Factory orders data was worse than expected yesterday, and that may have cast a pall on institutions and traders hoping for steadiness in growth and not a spike in either direction (even though most pundits are still ignorant of the fact that rising prices make GDP move higher despite slowdowns in production). As I mentioned over the weekend regarding constraints of the buyer of last resort, the reverse repo market, the Fed still plays with the concept of bank reserves to protect banking stability. The USA has a new stablemate in the Moody’s negative bond ratings barn, China. Their property debt crisis is the reason for the rating. Perhaps that added to the selling pressure on bonds.
Despite all the negativity in tech (from EVs to AMD/NVDA competition), Chinese e-commerce darling PDD is ramping up sales for its Temu app to compete against giants like Amazon. As the linked article indicates, sales are plateauing in the United States, and that could also be another indicator of the tapped-out U.S. consumer.
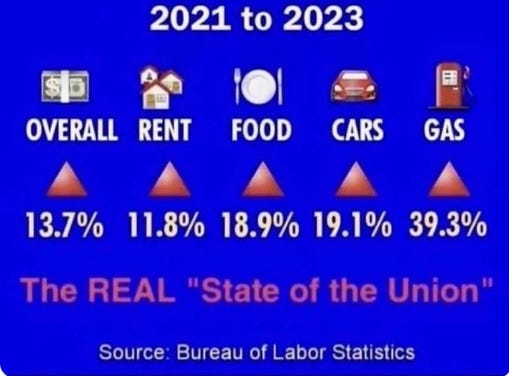
One reason the consumer is tapped can be seen below:
The other issue is the unaffordability of homes for Americans. As Redfin’s article describes the situation, it takes an annual income of $114,000 to purchase a home today, and that is, on average, $40,000 more than the average American family makes. Even if inflation is “cooling”, the price levels will remain where they are because of pure monetary inflation of the “covidiocy” era of handouts purely from the printing presses over the last four years and the unprecedented lack of a Federal spending cap.
Are we headed for round 2 of a bear market as Michael Pinto suggests? I think it is possible, as I have argued for some time, that valuations are held up only by the casino money pumped in by the Fed, and that he suggests that large-cap stocks are valued at 160% of the economy’s GDP. That valuation is unprecedented in market history. We will simply see what the Fed and Congress do to stop the mindless printing of money and how they manage the aftermath of budgetary restraints, assuming these entities and their leaders care about doing that. 6-week continuing resolutions are becoming dangerous and even more evidence to international markets that our government is fiscally irresponsible and that our bonds are too risky to invest in.
Let’s get back to the charts.
If MNQZ23 can remain above the 15801.25 VWAP line, it has an excellent chance to exceed the swing high of 15815 and move to 15829.75 and if it can exceed the VWAP line at 15832.75, it can hit the target level of 15840.25 by Wednesday. If we continue to see weakness, and sellers dominate, it will once again be a short trip back to 15761.25. If selling becomes aggressive, then 15746.50 and even 15728 are possible by Wednesday.
I picked up 22 NQ points long per contract yesterday, getting bounced for a 6 NQ point loss on the first rade and picking up 28 NQ points short on the second. I will take a look this morning at trading again should conditions fit my trading plan.
That is all for me today. Thank you again for supporting my efforts here. It is greatly appreciated. Have a profitable and happy Tuesday!
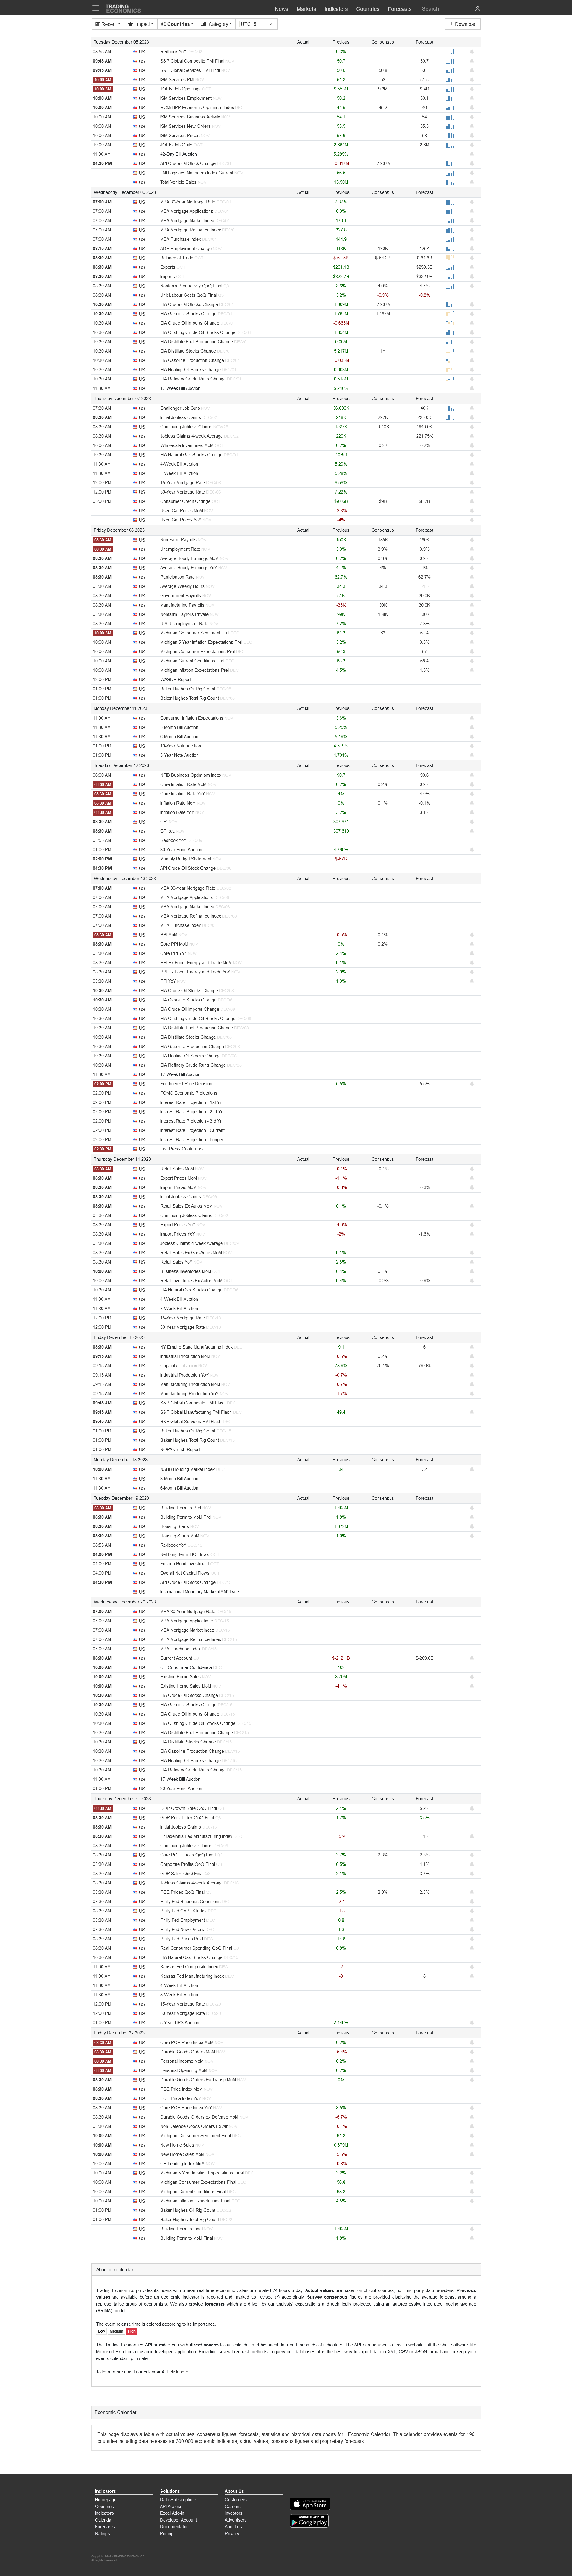
Today’s Economic Data Courtesy of Trading Economics dot com. Be sure to refresh the date at the top left.
I know several people in the tech industry who have just lost their jobs. We may be tapped out. More tech stuff to purchase than we can actually use daily or even weekly. I appreciate your hard work and research; something that is lacking on my page. LOL best wishes.