

PLEASE WATCH THIS VIDEO. I think it gives a balanced picture as to what could happen in the intermediate term and the long term, both long or short. Most of the price projection made in last week’s analysis seem to still be in play.
The monthly analysis begins at 0:00, the weekly analysis at 05:33, and the daily discussion begins at 9:28.
The two main charts of interest are below.
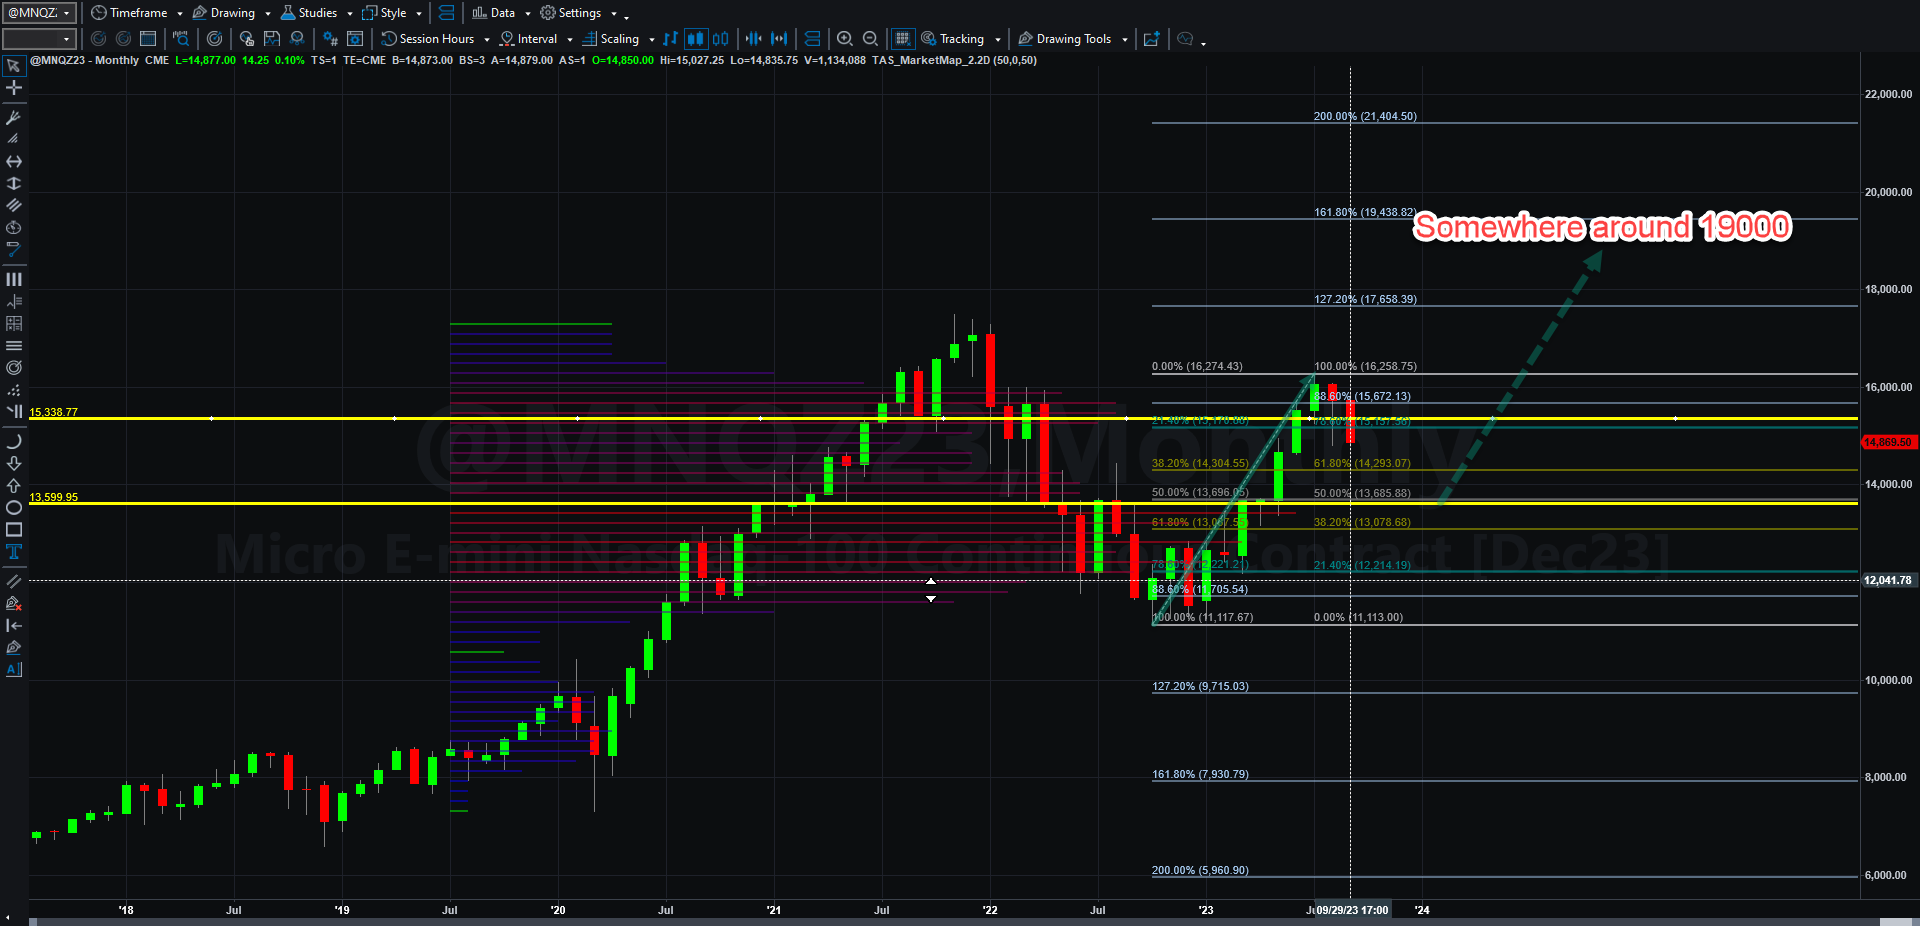
The monthly chart that demonstrates one of many possibilities of a bullish outcome after a significant correction to a VWAP line:
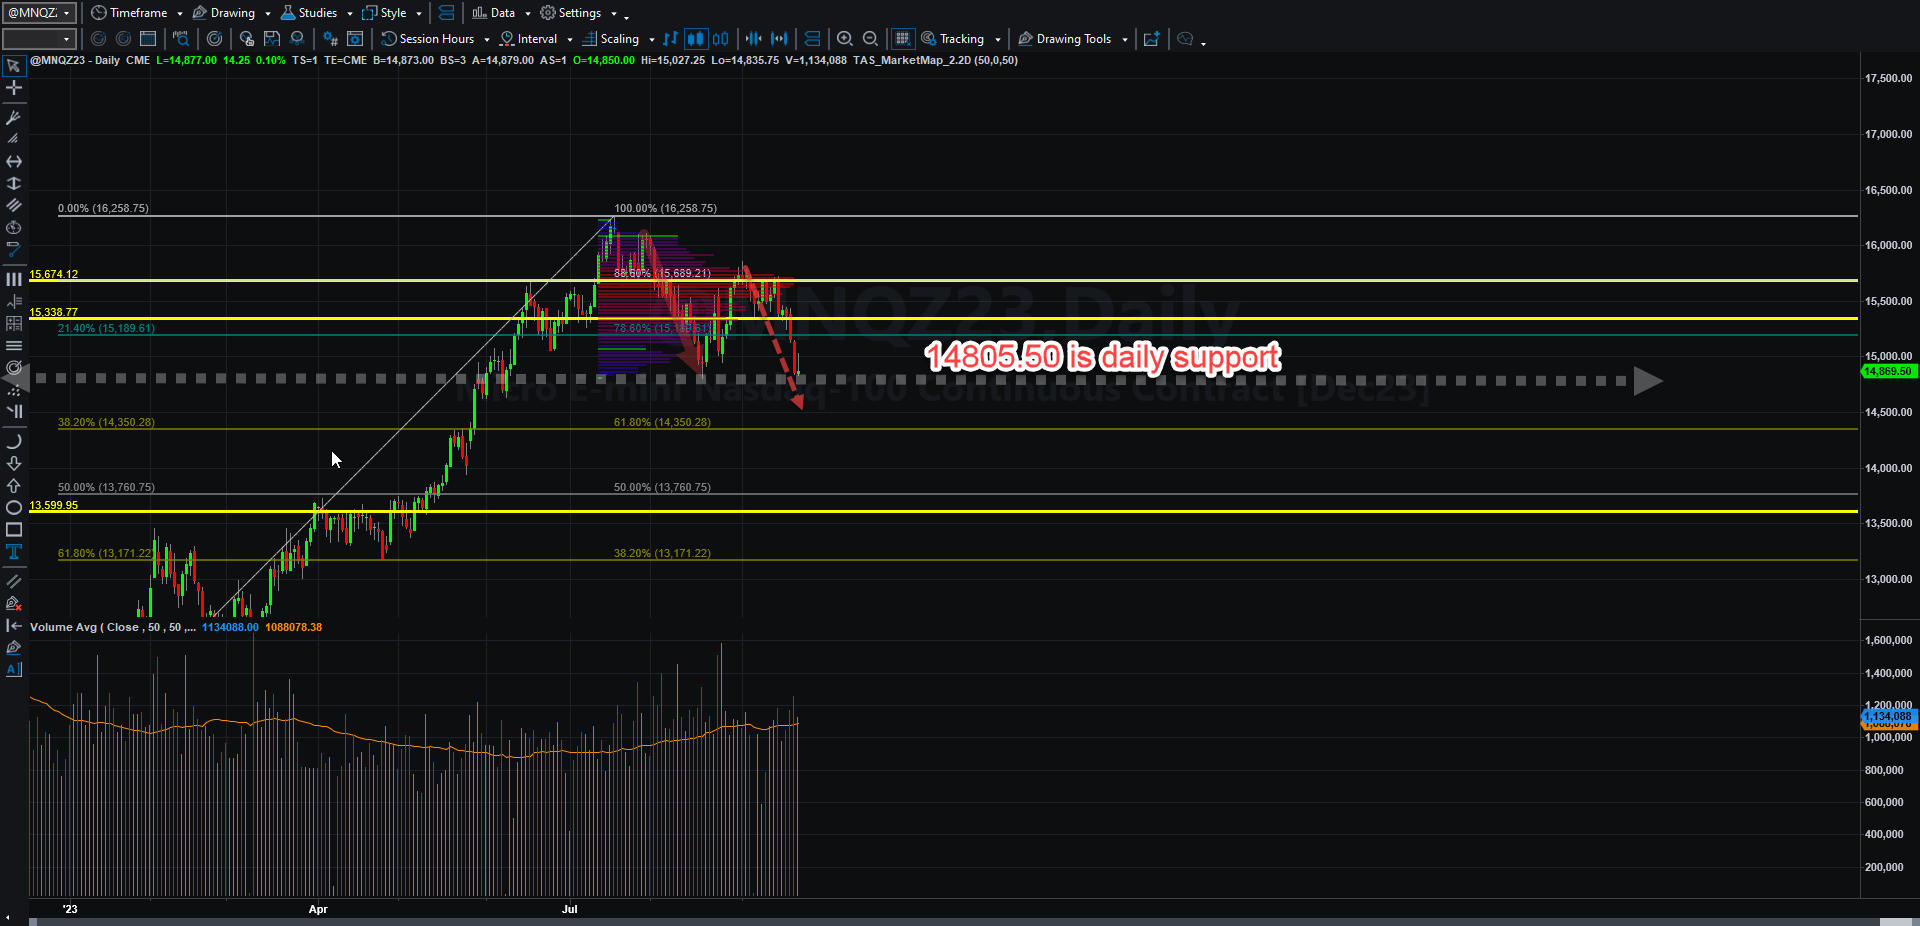
The daily chart which shows overall bearishness yet has yet to break below a key pivot established several days earlier (the 14404 projection made last week could still be in play, but it must take out 14805.50 first. Only time will tell:
The thing to realize is that even the mainstream analysts understand the QQQ and NASDAQ valuations (and not just for, but particularly in, AI names) generally are insanely high even with interest rates that are below the true rate of inflation, and certainly beyond the below zero levels after inflation over the last decade or more.
Among a large list of bearish precursors of recessions, job openings are now dropping rapidly. Defaults, savings depletion among American families and the cost of food and energy will likely very shortly cut off consumer spending. A growing number of hedge fund and institutional investors are reading the writing on the wall, no matter what mainstream media pundits are saying about a soft landing.
We will probably see which side (bullish or bearish) will win the debate in the next couple of weeks, and those scenarios or others will play themselves out as the end of 2023 approaches. I will simply not take sides other than to follow what my trade plan gives me.
More on this as time goes on. A fuller discussion of volume will happen tomorrow in the next episode of Setting Up The Trade. Have a pleasant weekend everyone.

