

This is Part 2 of the Video
Please watch both videos as I set up a Fibonacci Scale on an hourly chart much like I do every day in The Buffalo Trader’s Writing Desk. It covers everything from how to select swing highs and swing lows, how to lock in the scales, and how to measure from them. The chart I reference from the second video is below.
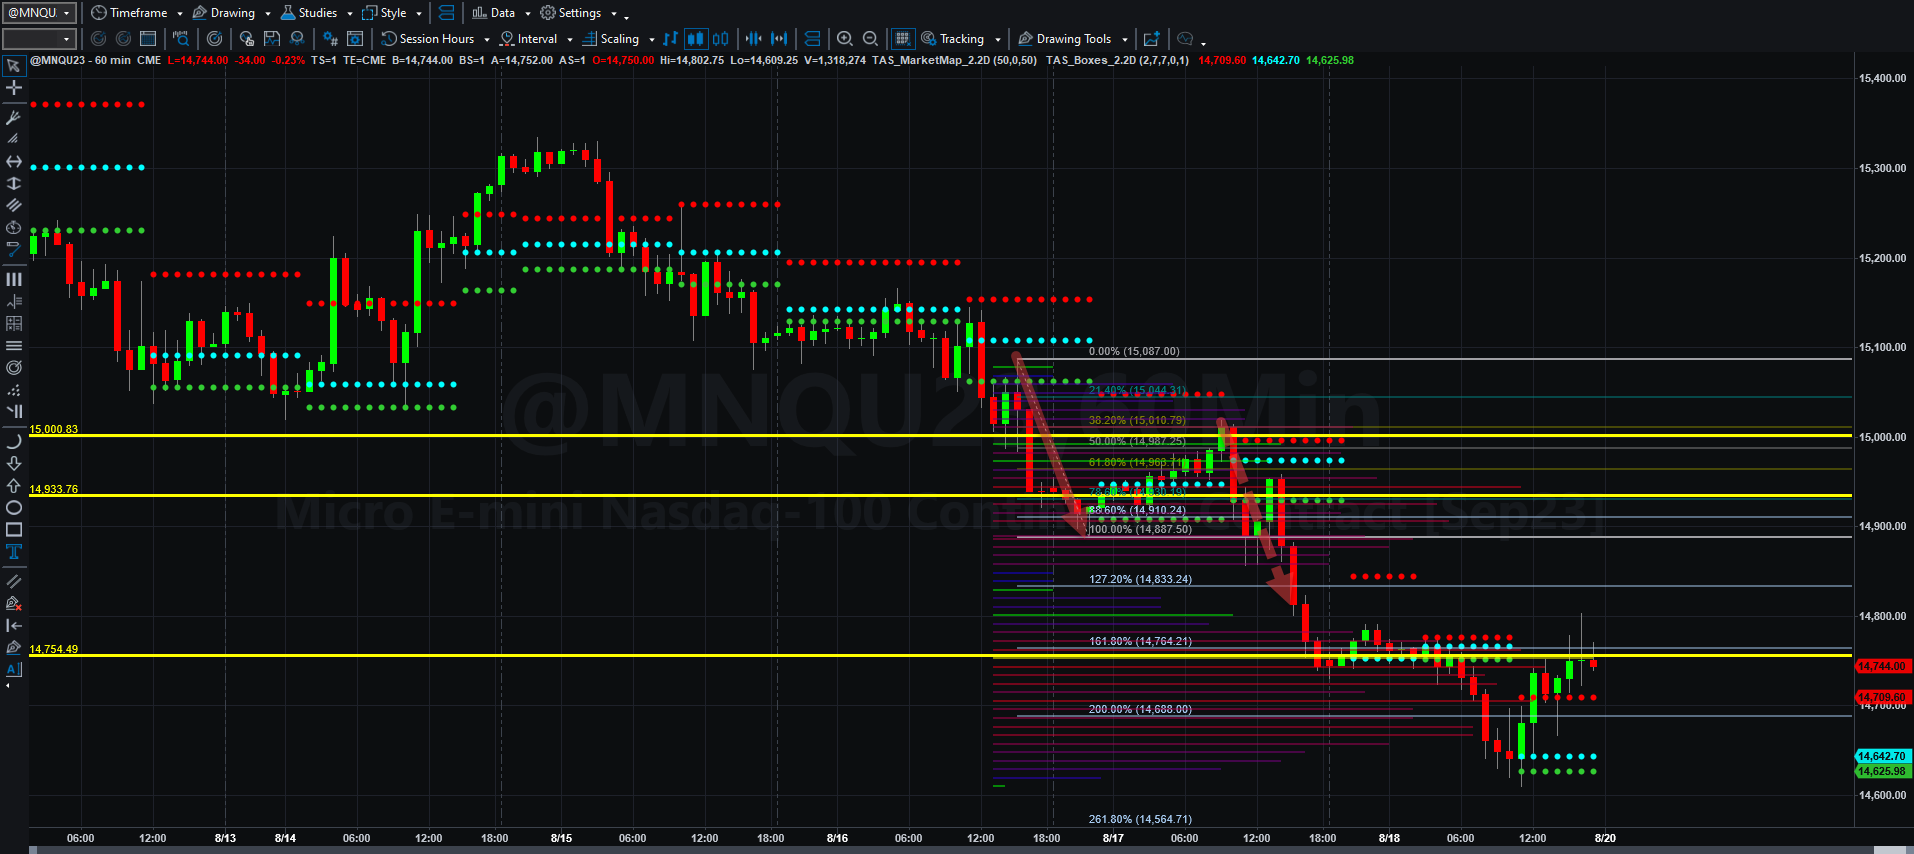
If you notice the opaque dotted line to the right on this chart, it is of equivalent length to the swing high to low solid opaque line on the right. It nearly perfectly aligns with the 127.2% bearish extension of that first down leg at 14833.24. Also note that it ran completely down to the VWAP line at 14754.50 before hitting resistance and finally falling into the 14600s. You will see extra trading action often move back to lower VWAP lines on a selloff. (You can also see higher VWAP lines touched during aggressive buying.)
If you have ANY questions at all. Leave them in the comments and I will answer them.
I hope this helps. If I can break it all down step by step, I think you can get a clearer understanding of my methodology.
That’s it for now. I may write briefly tomorrow also. Have a great weekend!

