

No video today folks. That will come again soon. I want to deal with the upside and the downside targets for MNQU24 and then discuss what is really going on and what one can do about it. We are not living in a normal market cycle, even though it does exhibit all the traits of a potential market top.
I will not get into deep specific technical dynamics other than with pattern analysis and a limited number of technical indicators. This will be short and sweet but to the point. The best way to look at the bearish target for MNQU24, one must look at the monthly chart, and the cleanest way to look for the bullish target for same, one must look at the daily chart.
MNQU24 Bearish Target Estimate
What you need to realize, as will be shown in the daily chart below, is that MNQU24 has already once failed to penetrate resistance at a VWAP (volume weighted average price) control point of 19884. If it cannot penetrate that and sells press, it could indeed take out the long candlestick wick at 17346 on 08/05/2024 with any aggressive selling action. You can look at the daily chart to see how that sets up.
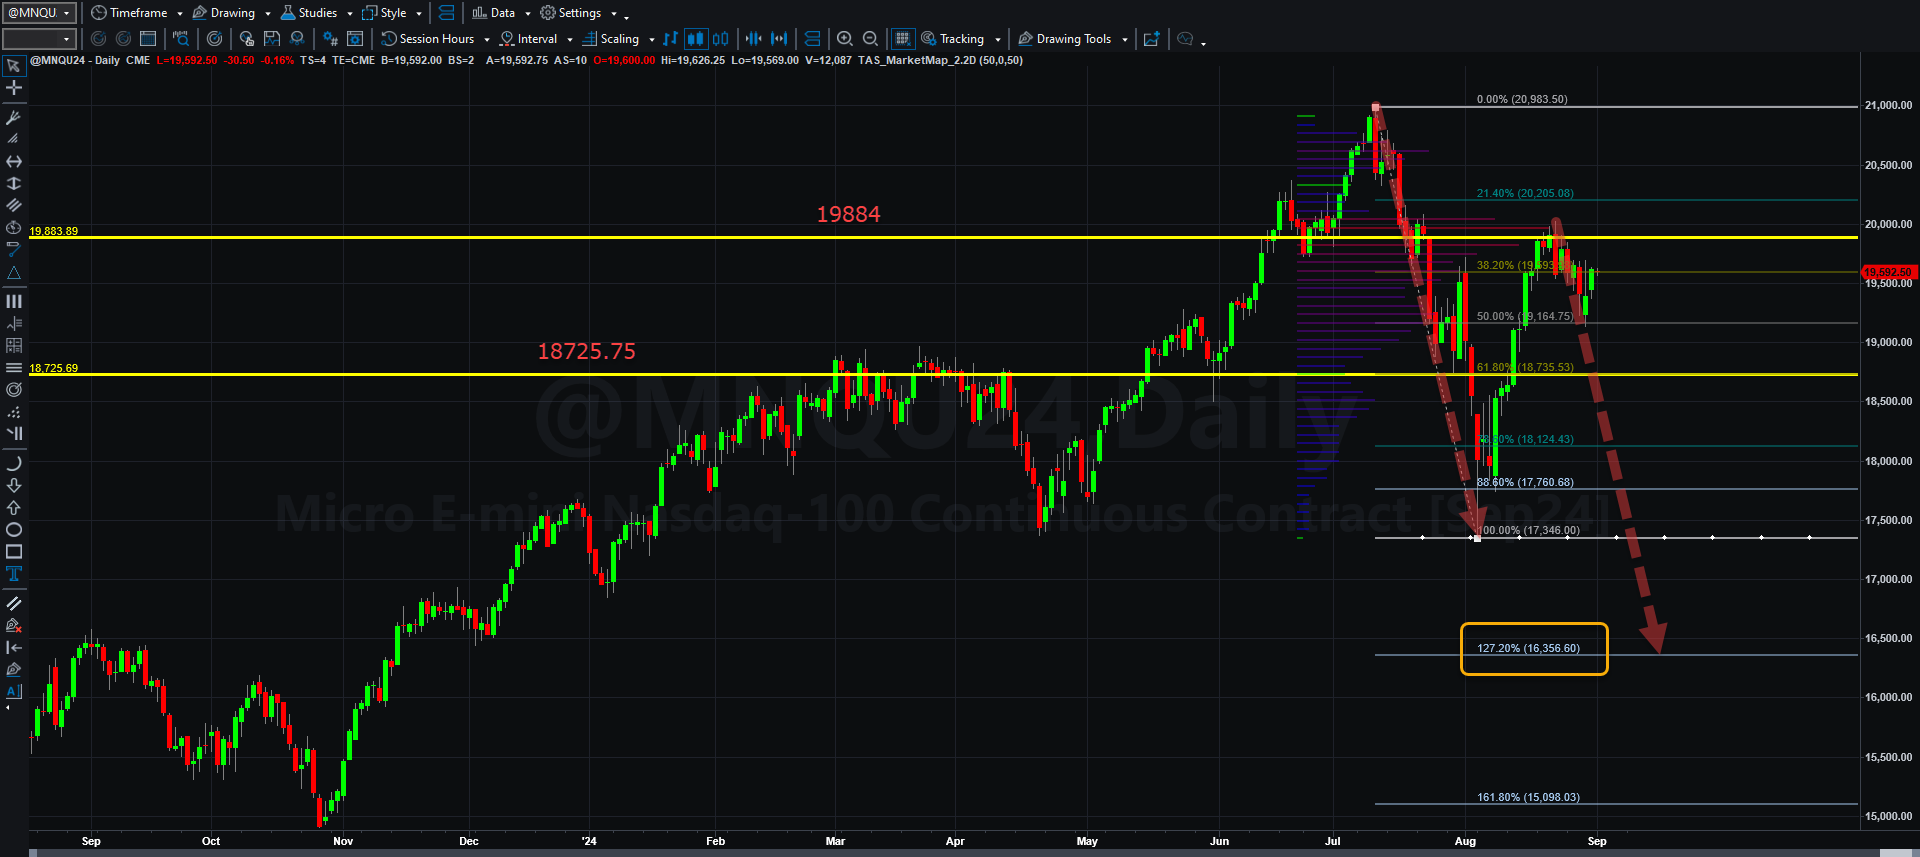
If a typical AB=CD bearish pattern is supported by aggressive selling,
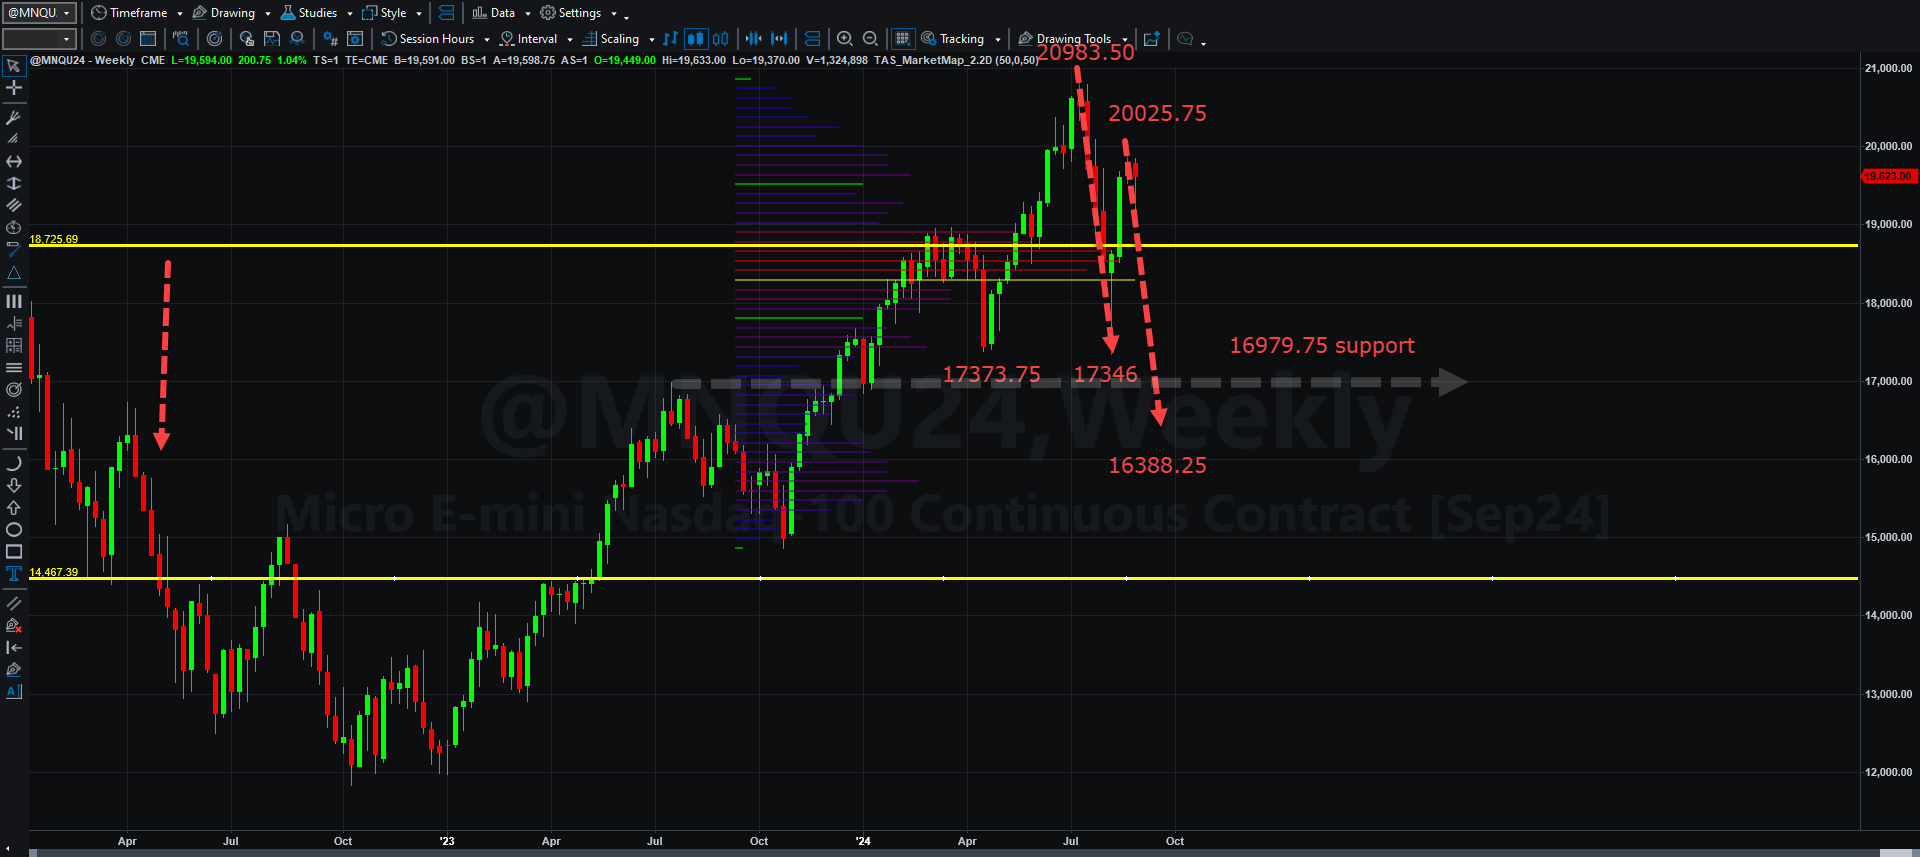
What you would see from the monthly chart, noting that on the above chart price failed to hold above the 61.8% retracement of the first swing down to 17346, that it could result in an equivalent swing to the downside, assuming sellers become aggressive. Because 19884 is still key VWAP resistance, a failure to take that price level out would result in the monthly chart target down below:
MNQU24 Bullish Target Estimate
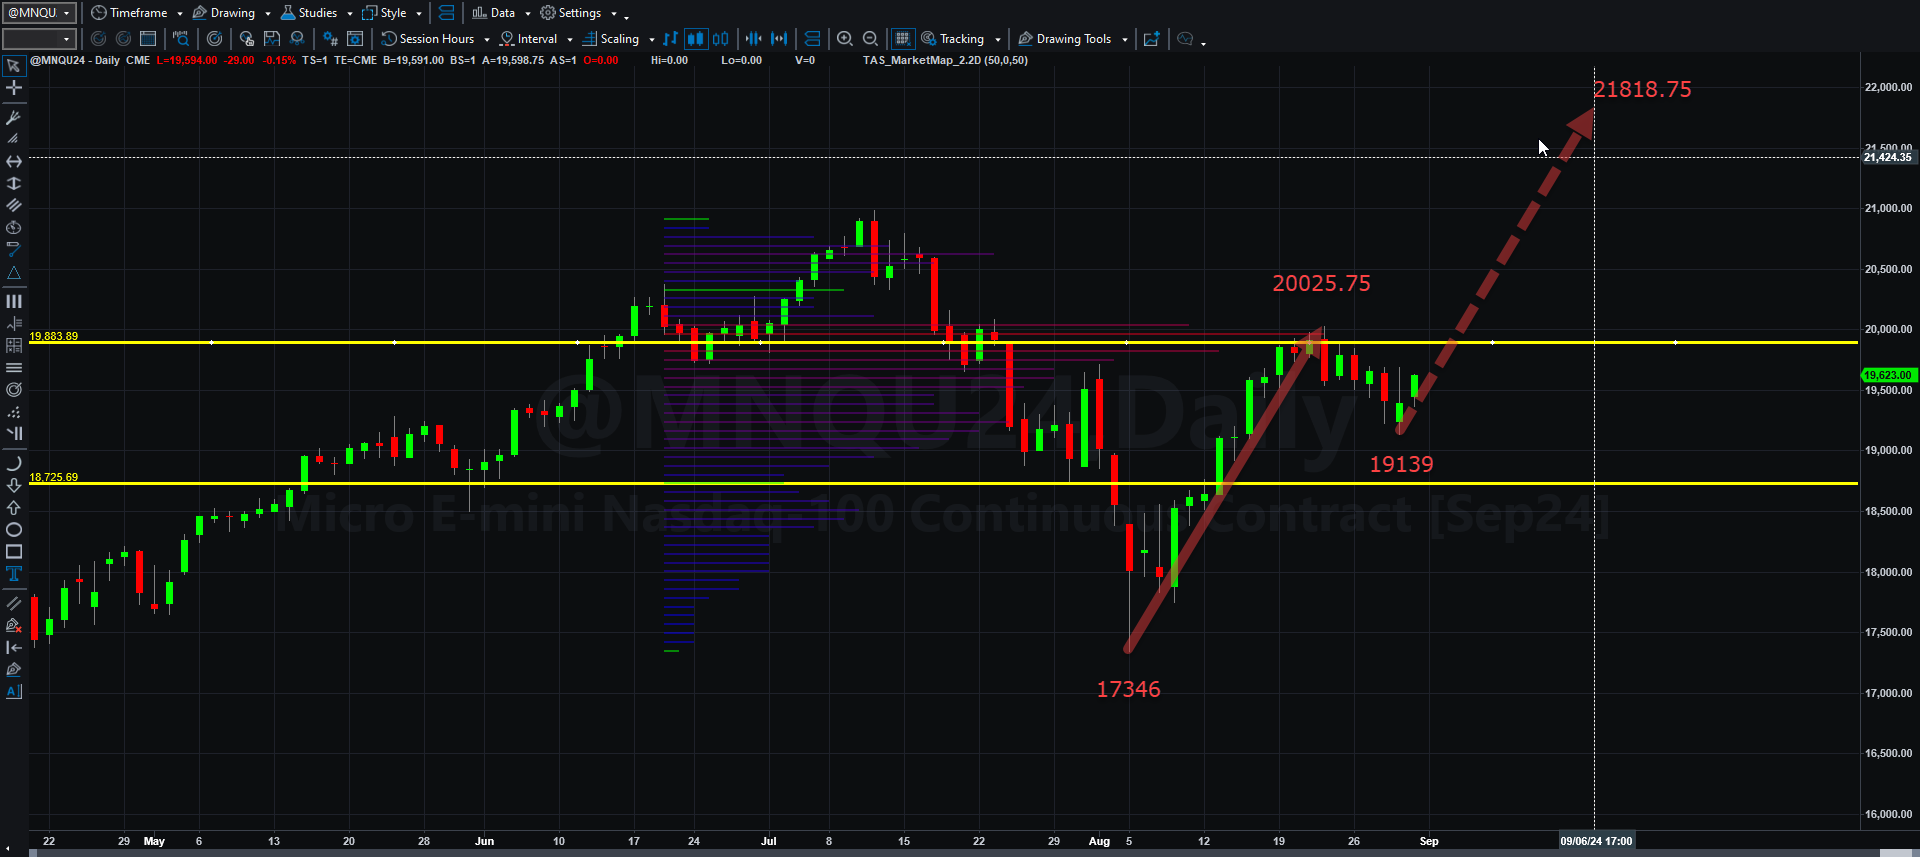
Even though we have not completely established a price pivot, price has exceeded the last swing low on the daily chart, and there is bullish price strength based on the latest daily chart. If that holds, then the natural AB=CD bullish target could be 21818.75 if the price symmetry and time symmetry remain solid.
I could show you tons of moving average analysis, volume profile analyses and any manner of pattern analyses, candlestick observations, and God knows what else, and one thing is for certain. The direction of the market, while still up, is running into headwinds. The entire world is facing a crisis of social, political, and societal upheaval. If you are in the EU (particularly France, and Germany), the UK, Australia, New Zealand, Brazil, and the USA, you know exactly what I am talking about.
The question for all of us is how much of this is real, and how much of this is simply bluster? I will try to briefly and concisely answer these questions in this post. It may require you to watch, read, and listen to content, but I will post all of it that I can.
The categories I will chose deal with common market concepts, world conditions, and economic conditions.
U.S. Market Valuation
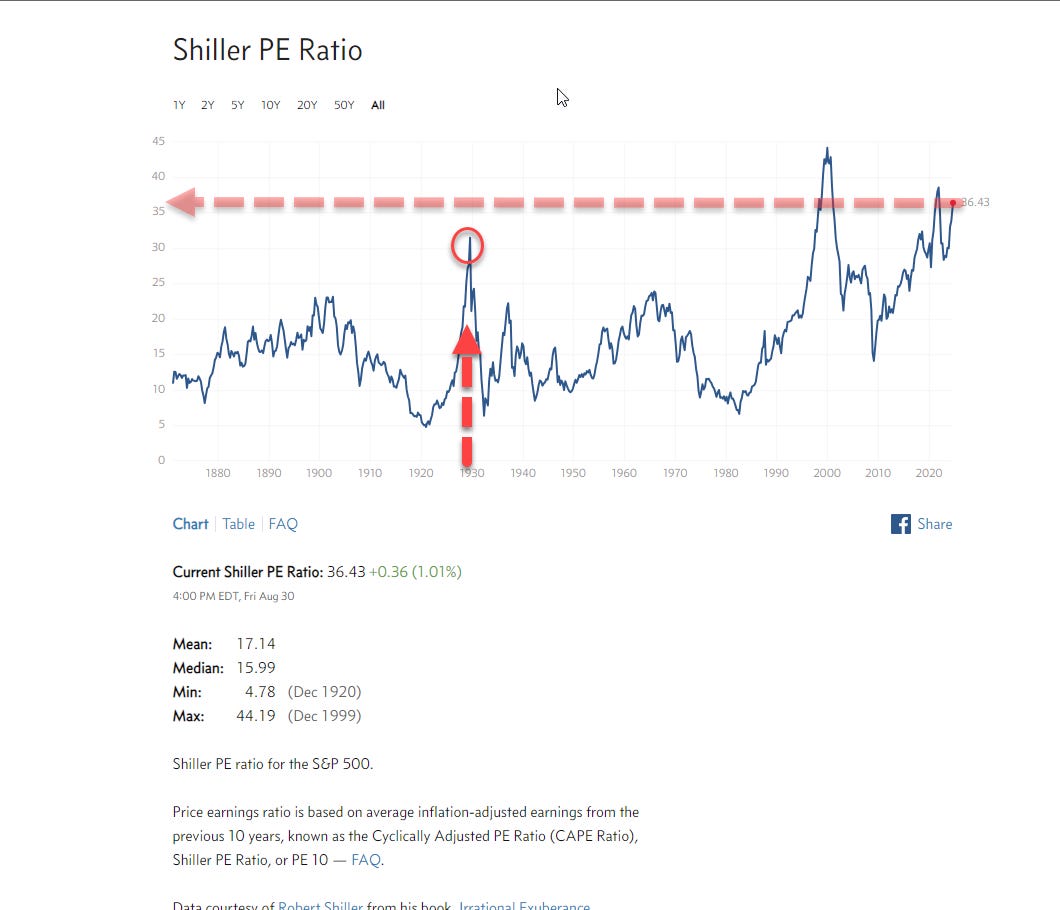
Image was distorted by most measures, the $SPX is overvalued, nearly to extreme levels not seen since 2000 and higher than during the period before the 1929 crash. I would consider that situation real, not imagined. If the U.S. Federal Reserve cuts rates by a quarter point in September, even though it is expected, it is my belief that the crowd that loves easy money (banks, hedge funds, mutual funds, and institutional investors) will continue to think the party is on, and valuations will be skewed higher by that very act.
I could get into the valuation of NVDA, but I won’t, save to say that at current valuations, based on discounted cash flows calculated on the website alphaspread.com NVDA stock is roughly 28% overvalued currently. One can also see that it has a bright future ahead of it on gross margin and net margin basis, but under current conditions, the price is extended.
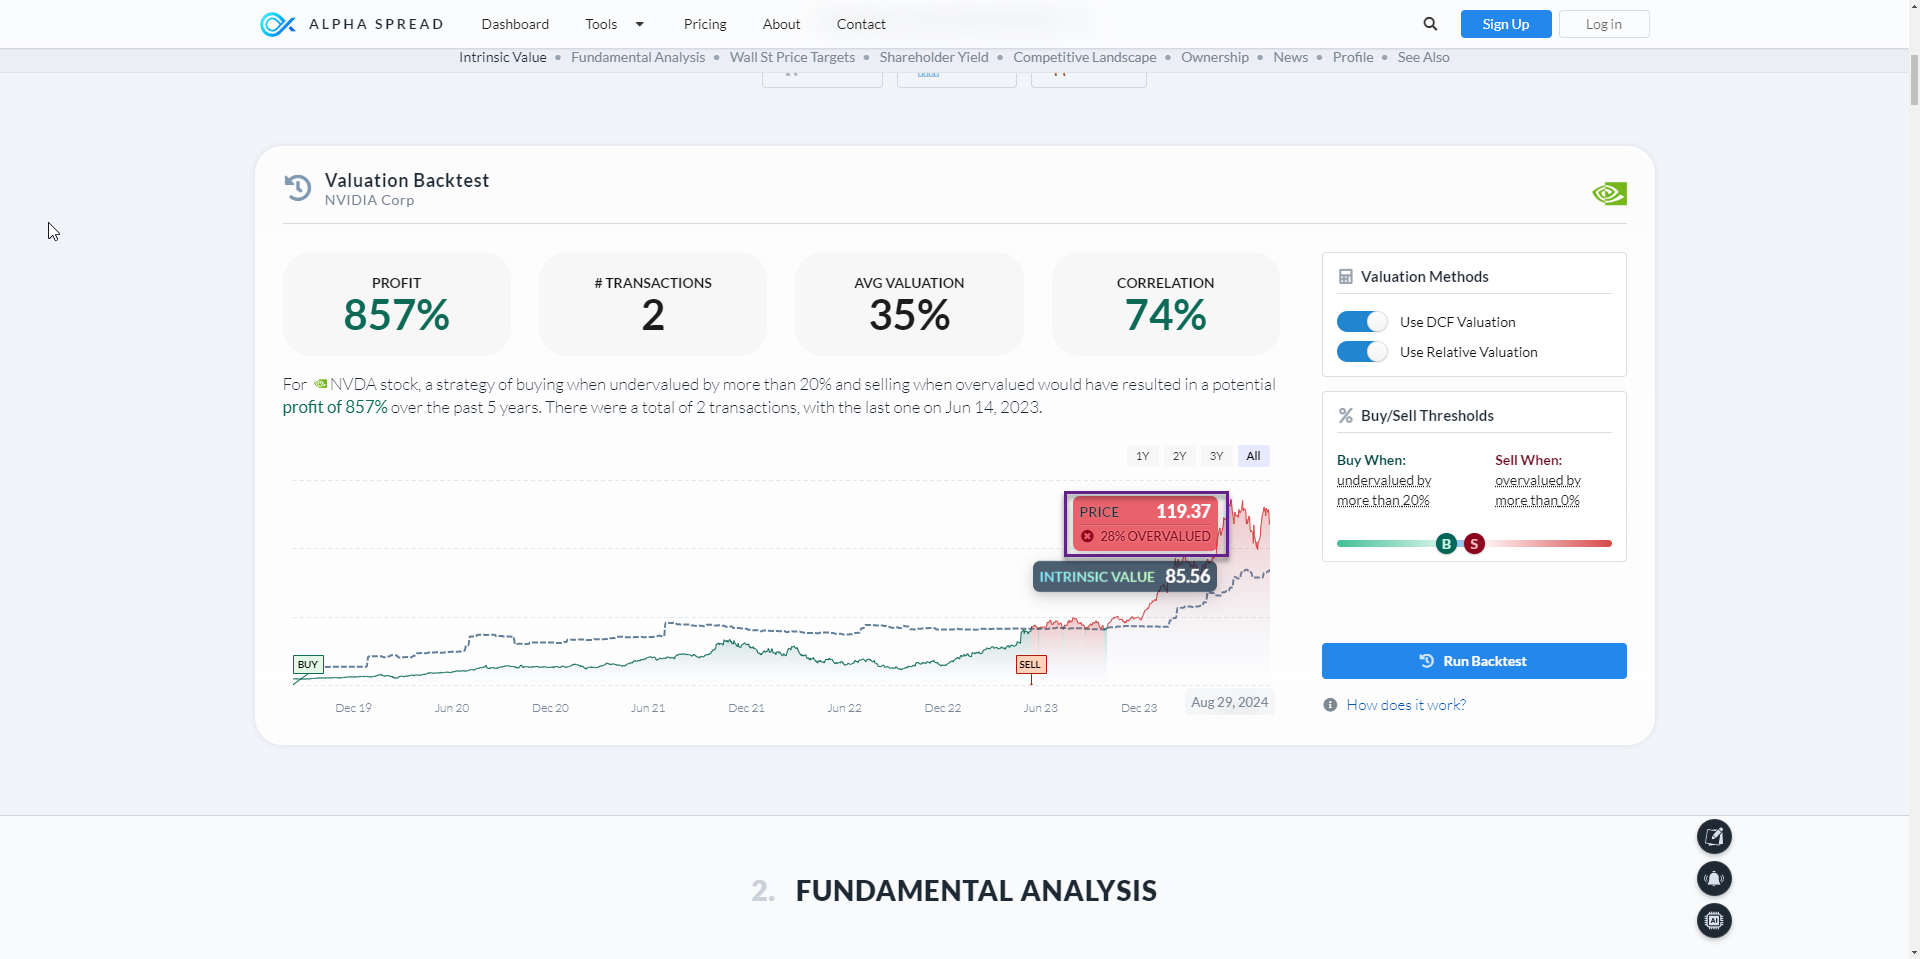
I think that condition is real and accurate, but there are also other factors involved with NVDA, as mentioned by Michael Gayed.
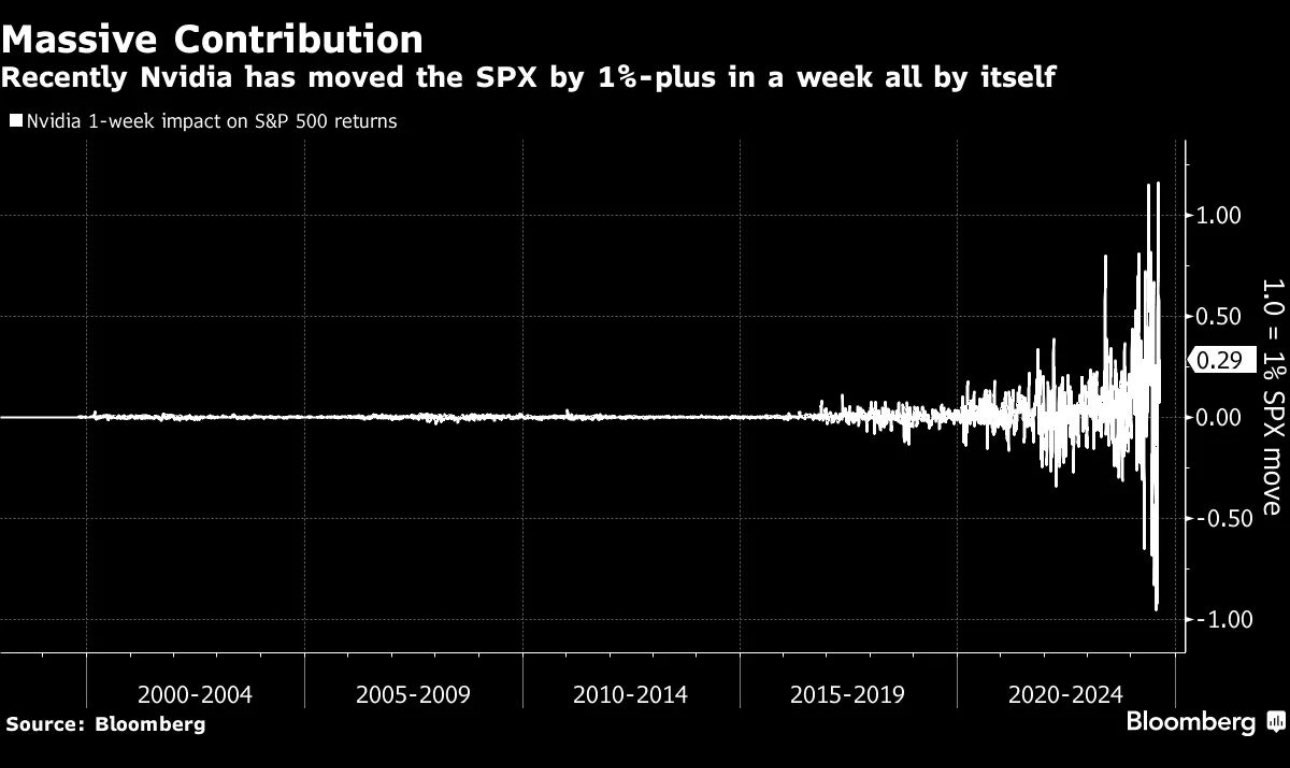
As of August 30,2024, NVDA had 2.928 trillion dollars of market capitalization compared to 47.409 trillion dollars of total $SPX market cap. That means NVDA is equal to 6.176% of $SPX market cap, so when it swings in price wildly, so does the $SPX. It is a large component of $SPX market volatility.
That covers a great deal about market valuation, but what about the U.S. economy? Are we near a recession?
Chances of Recession
I could get really technical, but the best way to discuss the possibility of a recession is covered in this video by Game Of Trades. I do not endorse nor use Game Of Trades, but I do like their summary of economic data produced about 3 times a week on average. Watch this video (I mean it! :D). You will see how for the first time in quite some time (over 700 days), the yield curve is reversing its inversion, and could be attempting to rise again. A continuing unwinding of the yield curve inversion usually leads to an increase in unemployment (something we have already seen) and a full-blown recession after that. That, unfortunately, is also REAL.
I did take one screenshot from the video and linked it below:
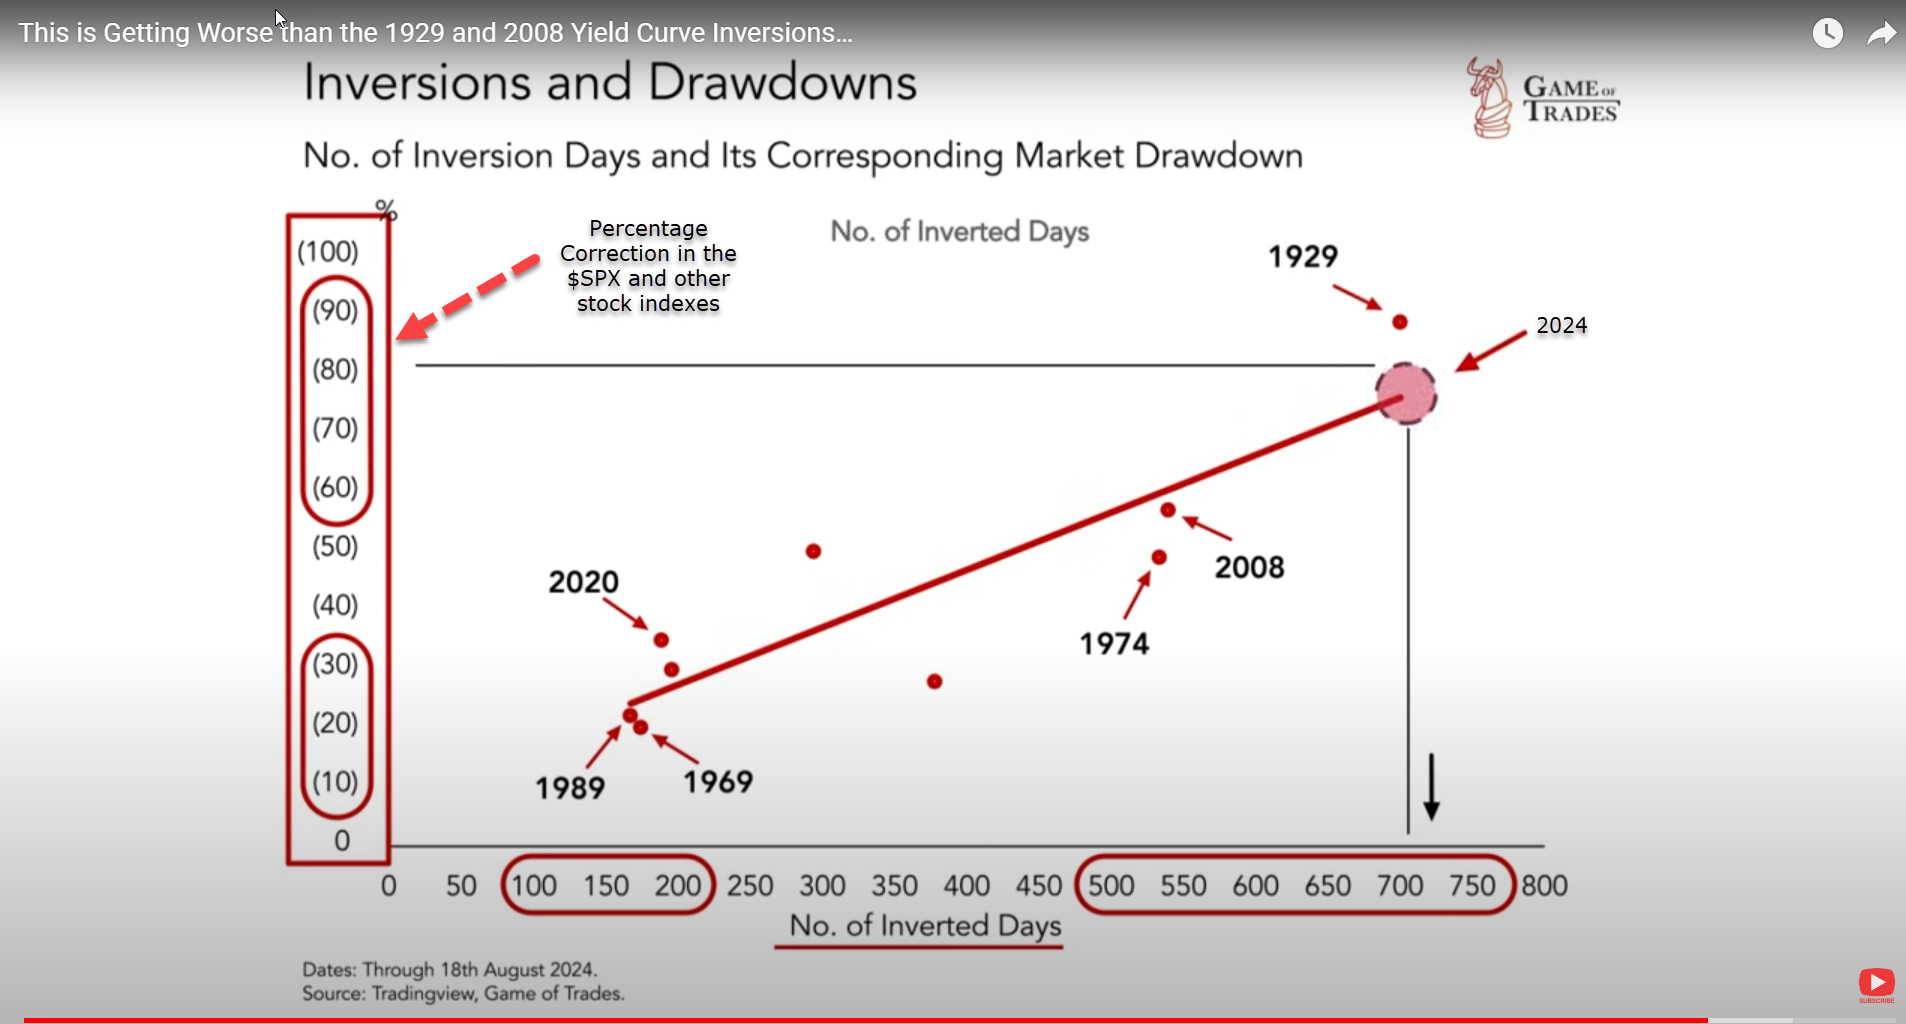
We have essentially tied for the longest period of yield curve inversion with 1929. The correction that followed resulted in a nearly 90% drawdown in stock valuations. What will happen this time? I have no idea, but when one sees Shiller P/E levels at near records and the length of inversion being this extended, once has to wonder if another price haircut is coming around the bend. One would have to really did deep to find bargains in this stock market that you could hold onto and ride, unless you want to ride the inevitable drawdown.
Budget Deficits and Federal Reserve Policy
As the Fed continues to hold interest rates at the highest levels since 2007, it continues to pile up interest payments on debts with higher coupon rates.
From Fiscal Data comes this chart that shows how the U.S. Federal Budget year to date has been segmented.
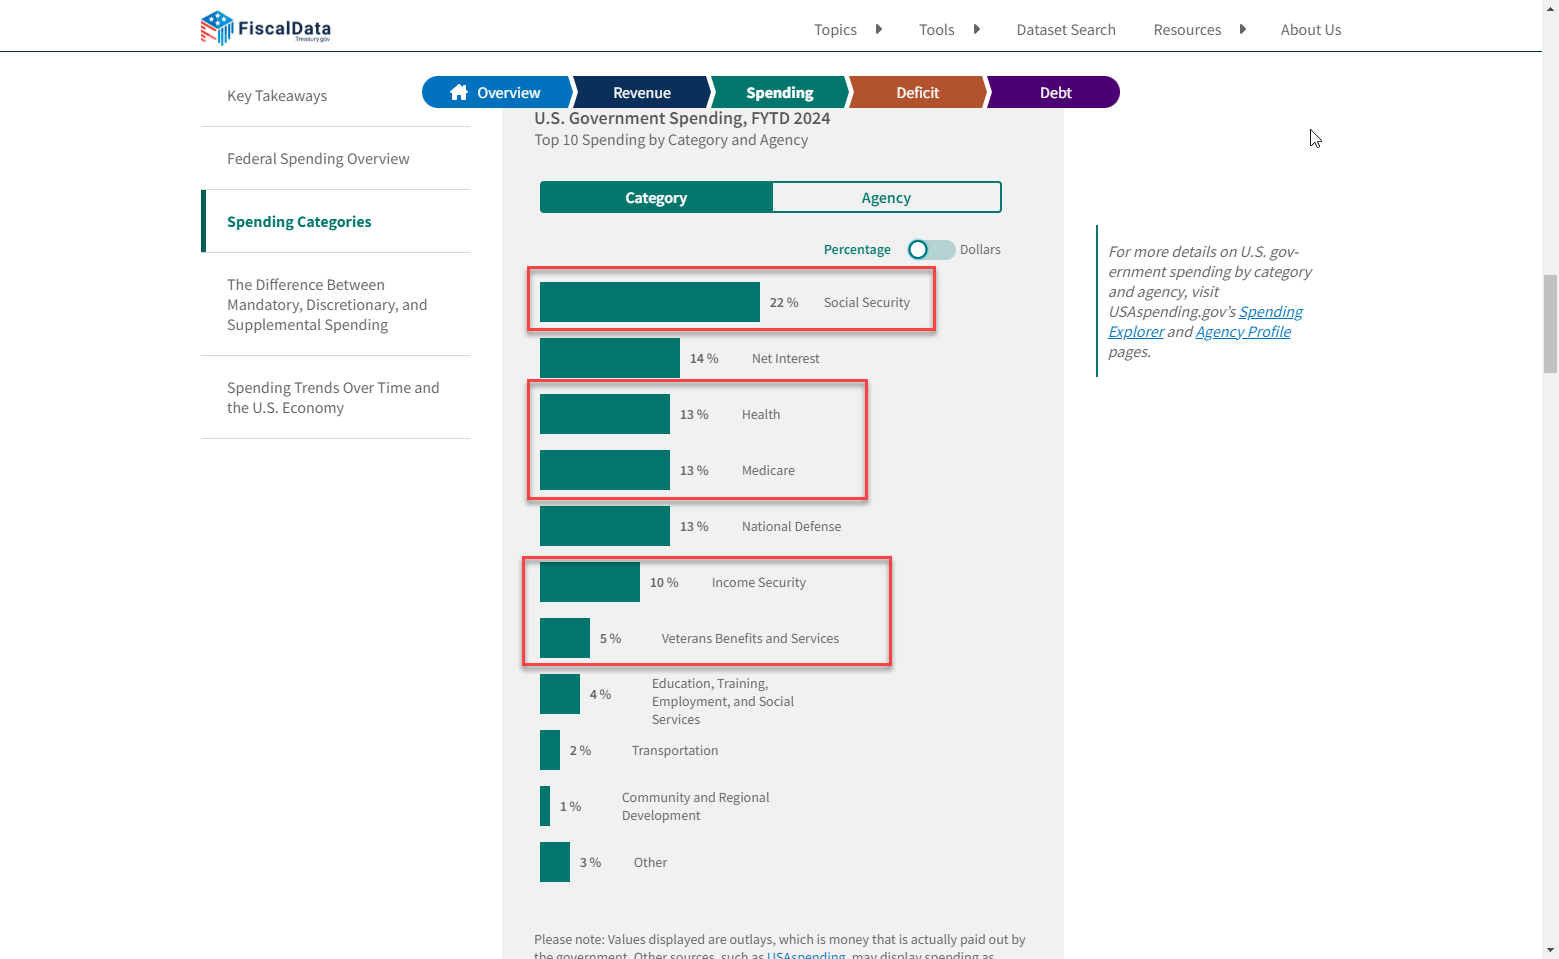
If you do the math, approximately 63% of our Federal budget is devoted to entitlements (basically handouts). Notice also that interest payments have finally swamped Federal defense spending and is well on its way to surpassing the number 1 item (Social Security). If you want to see the dollar amounts, you can toggle that information at the top of the page.
The difficulty here is that in this Presidential election year, neither party is dealing with the fact that, in order to balance the budget and to keep the government from going bankrupt, it needs TO REDUCE SPENDING and CUT ENTITLEMENTS. It is that simple.
What we get from Donald Trump is that he will protect Social Security and from JD Vance we hear about extended tax credits for families. Sounds like a furtherance of entitlements doesn’t it? It is! Neither of these gentlemen have really dealt decisively with the need to cut spending severely or to shore up the currency either. Perhaps they’ll stop the printing of currency to pay for more entitlements as occurred during what I refer to as the ‘Covidiocy’, but I still don’t hear much of a plan involved. I really don’t care about cat ladies, I care about stabilizing and growing the economy. The RNC candidates are like mid-1980s Democrats though they skew more toward free markets and not toward Marxism as the DNC selectees do. Wishy washy policies got us to where we are now. Promising more will not solve any problems. It will make them worse.
The DNC candidate-du-jour for President will continue spending and printing to support the spending, and that will continue to fuel inflation, as inflation is a MONETARY phenomenon and nothing more. We can only expect more currency debasement under those circumstances. It is a recipe for disaster. Oh, and did you know the DNC supports free down payments for illegal migrant homeowners?
Is that a real existential threat to the economy? It most certainly IS!
A good discussion of potential outcomes of the United States’ debt crisis, watch this video from Luke Groman.
Inflation
I basically gave you the rundown of the fact that it seems neither side of the two major parties have any intention of cutting spending. They are rather prioritizing them. The DNC seems not problem with spending and will print into infinity to drive the American taxpayer into poverty. The RNC candidates will simply do it more slowly, but with a similar result over time.
Think the Fed is really concerned about keeping that target rate of inflation at 2%? Well let me provide you a bit of data.
Most data indicates virtual certainly that the Federal Reserve will cut the prime rate by 0.25% in September. Now, look at this chart, provided by Bloomberg and drawn up by Lawrence McDonald.
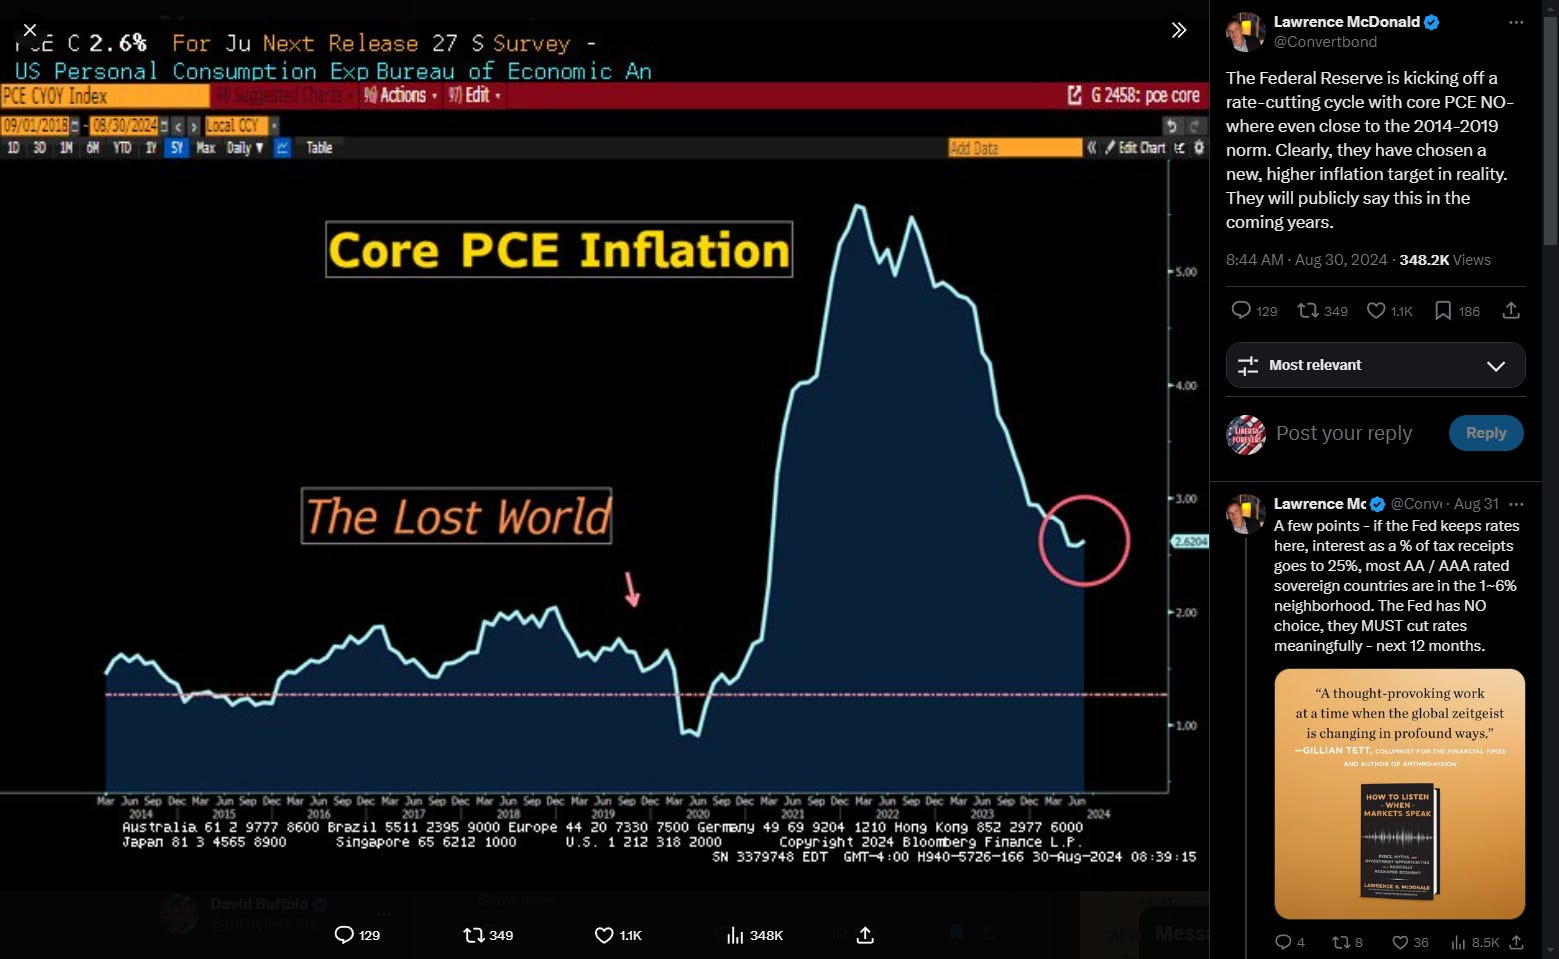
Take note. Core PCE is well above 2% (2.62% and change to be exact). What happens when you cut rates (and particularly if Congress is trying to print as much as a trillion dollars in a quarter if need be to buy things, like weapons for Ukraine? You get INFLATION! Add 0.25% to 2.62% and you get basically 2.87% inflation, not counting food and energy which are of course the most volatile portions of consumer inflation. If the DNC oligarchy is ascendant again to the White House, what will happen? Fracking likely becomes restricted and oil production will slow ( a great thing for oil companies as oil prices will rise from inelastic demand) and inflation will increase even more, as energy is used in broad spectrum across the entire economy. Basically, what I am saying is round two of inflation and perhaps hyperinflation is on the way.
Does that happen under Trump? The Fed may indeed cut rates (a bad thing in my view for housing and for core consumer expenses), but drilling will continue, and oil prices will drop.
We really won’t know how this goes until after November, but one thing is certain. It seems the Fed has abandoned low inflation for the American consumer in my view, and that is a bad thing.
I have covered the U.S. stock market and the U.S. economy, now let’s deal with world events.
World Events
In case you have been living under a rock (and it would be excruciatingly hot in a South Carolina summer), you know there is madness afoot.
The American Uniparty (RNC and DNC mainstreams) are allowing U.S. bombs to be used on Russian territory. If Russia were not on the verge of winning the war against Ukraine, it is my belief that Russia would indeed escalate the conflict to strike the U.S.A. and a kinetic nuclear war would result. Is that real? You bet it is. It is too bad our politicians make too much money from defense contractors fomenting these conflicts. If the world population is largely annihilated, that would definitely hurt market liquidity, trust me. The odds of that are NOT zero.
There is a move afoot by global governments to stifle free speech. Elon Musk, Donald Trump, Tucker Carlson, Tommy Robinson, Russell Brand, Pavel Durov and others are being persecuted for their political speech and being targeted for incarceration. It seems to be the goal of the United States Uniparty, the EU, and the World Economic Forum to revoke free speech and to limit free exchange of data.
The following video summarizes a lot of the major threats to freedom proposed by globalist organizations, including the capture of Bitcoin, which is a possibility. You may want to watch this and take notes, tossing what looks sketchy and keeping the rest. It is worth the watch. This video delves into the subject of neo-feudalism and now both American major political party mainstreams actually support it.
We are headed down some very scary paths if certain events occur and all those could start as soon as January 2025 if all three branches of government fall into American Uniparty hands.
Conclusion
I think the market is approaching a top, even though as you have seen from the charts, it could have another 10% upside as we see what happens to the yield curve. If you are long stocks, you probably need to have a hedge strategy with index or individual stock options to protect for the downside.
I own land and in fact, in a slight pivot from my original shift into raw land, I have sold my bulk of small tracts to another buyer wholesale and should be able to obtain roughly a 30% return in nine months. Not exactly option profits, but it is secured by hard assets, done in 6 months, and the process could be repeated quickly. Instead, I will begin to focus on larger tracts with partners but working with active buyers who are not just kicking tires, but ready to do commerce. When I abandoned holding stocks long (completely by the end of 2013), I decided to trade long and short at the margin to profit from moves in either direction. I still own land and I will still run other small businesses as I trade, but I want to be flexible in my approach to financial markets.
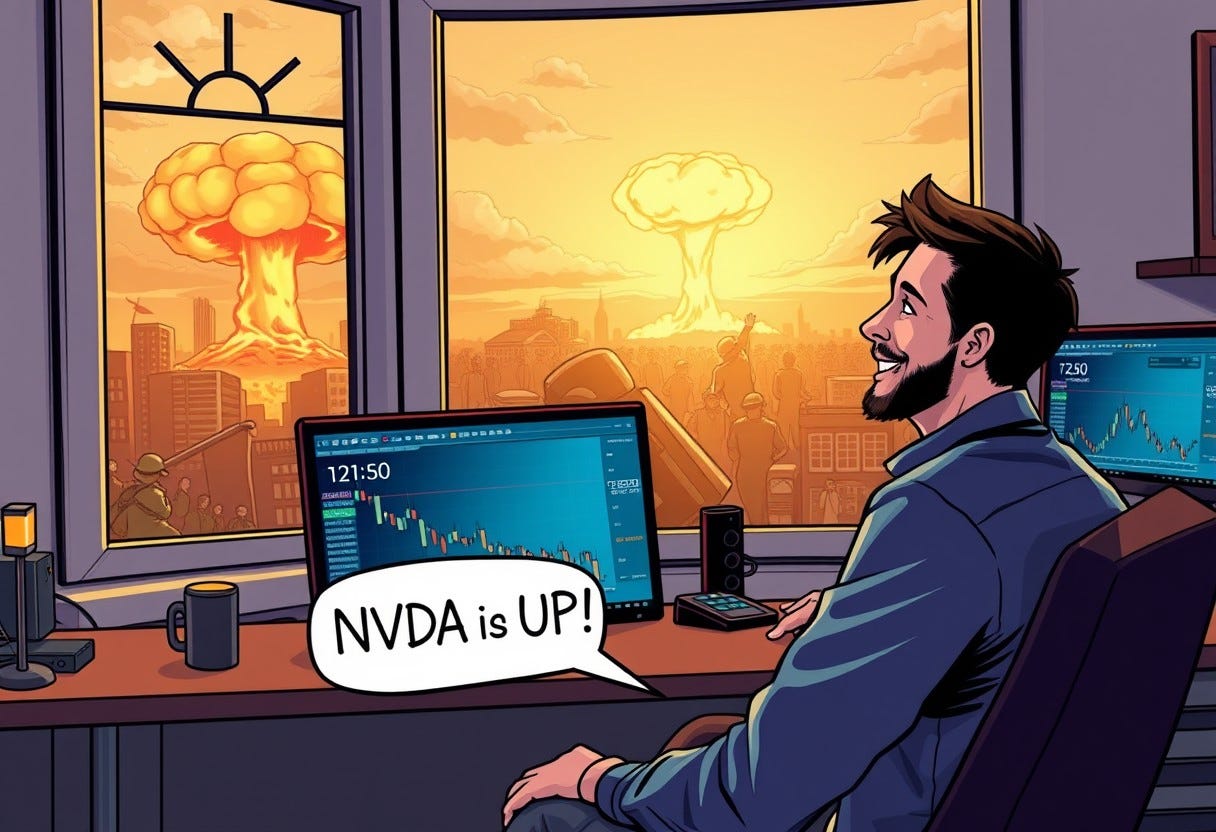
What could be coming in the very near future could shake up everything we know about asset ownership and trading in markets. We are all just going to have to keep our eyes open to events. The AI comic image I created with Stable Diffusion and Flux sort of gives you the idea what what we will see perhaps. I just hope the next flash of light is a price alarm and not a blast zone.
Thank you again for supporting The Buffalo Trader’s Writing Desk! I continue to get subscriptions from the app which humbles me greatly. I am still working on plans to make this a pay site to allow me the freedom to improve content, but those are still up in the air.
Have a wonderful week trading and in life!