This video gives you a brief discussion of how VWAP and pattern symmetry can show you potential downside targets for MNQU22. ANYTHING CAN HAPPEN of course, but this gives you an idea of how price action could set up if the weekly rally of last week eventually fails.
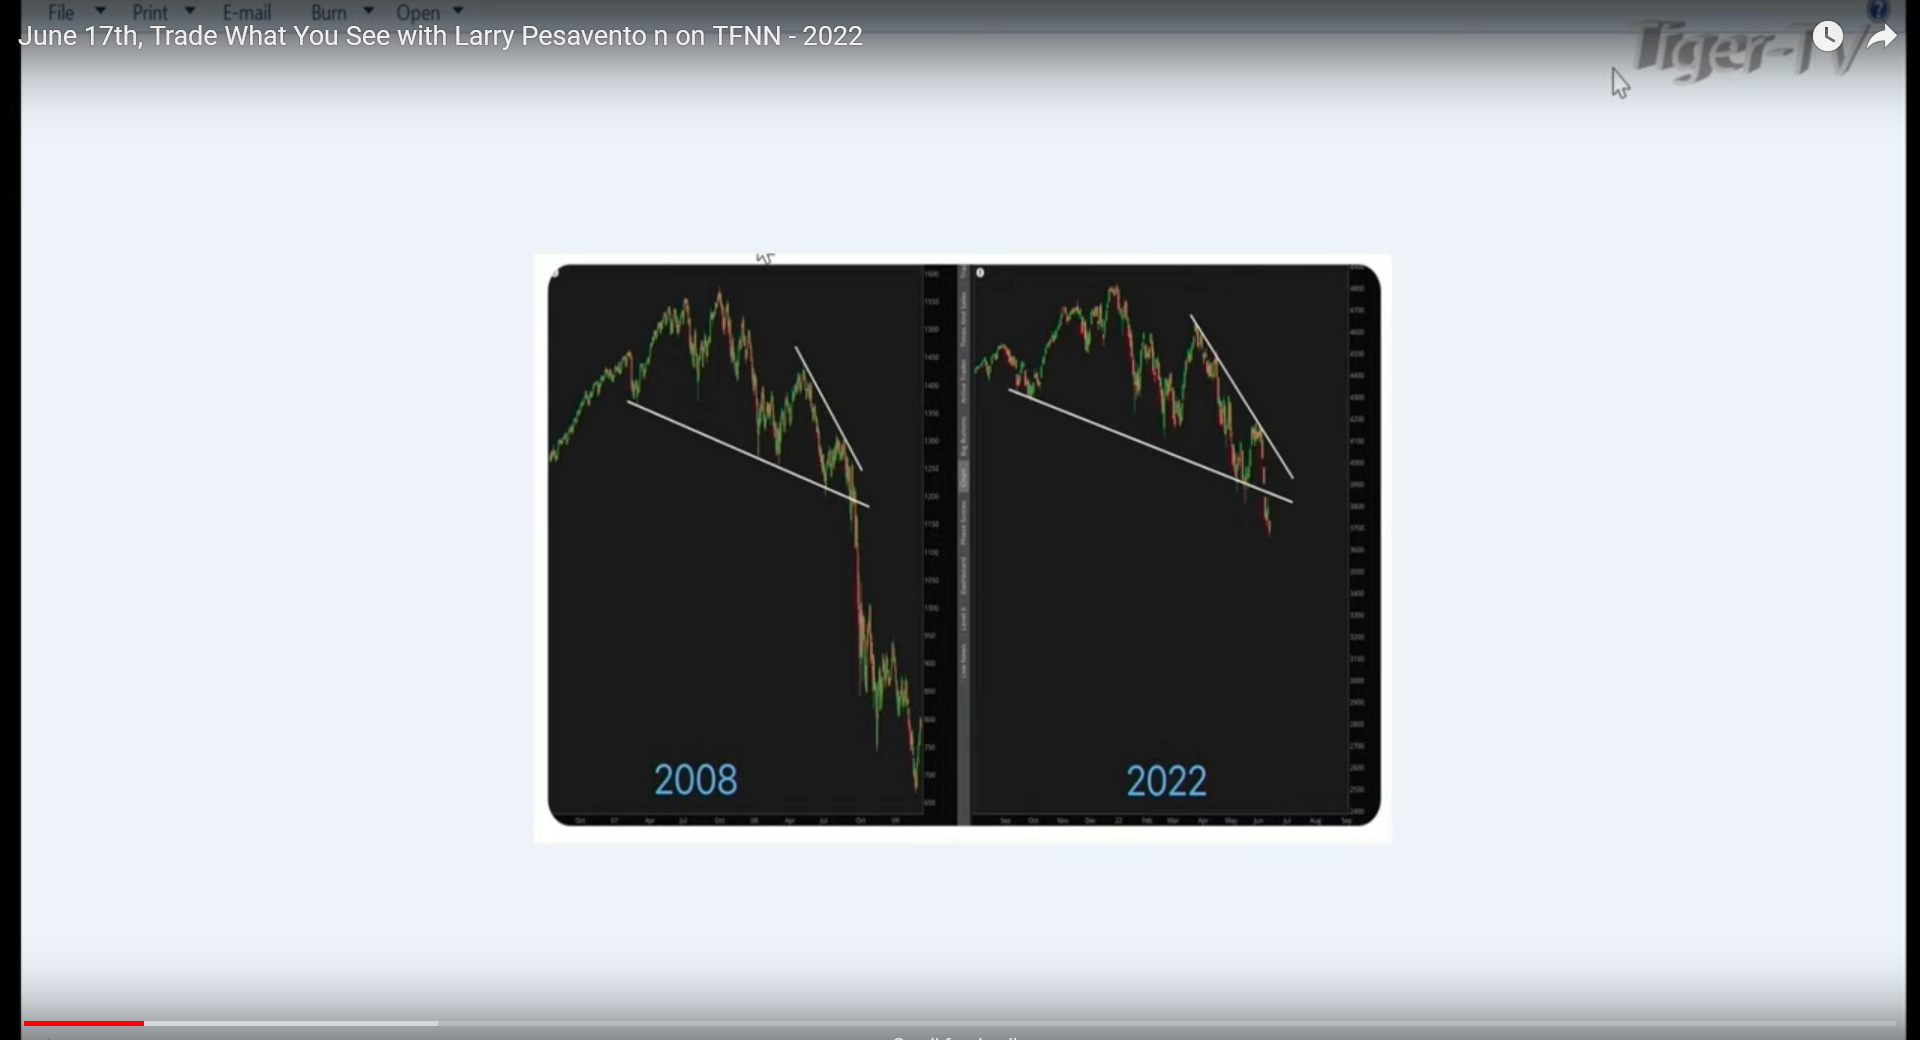
As a bonus, you can also take a look at a price normalized chart of the $SPX provided by Larry Pesavento in his June 17 TFNN broadcast. He was out this past week with laryngitis, but the chart still has relevance. It shows how similar $SPX price action in 2008 resembles price action in 2022. If you want to watch the entire video, go to this link.
More of my analysis, and more of my commentary on various things, will be coming soon.